Gold price sticks to modest intraday gains amid rising geopolitical tensions, softer USD
- Gold price attracts some dip-buyers on Friday as geopolitical risks help revive safe-haven demand.
- The optimism over the US-UK trade deal and the US-China negotiations might cap the precious metal.
- The Fed's hawkish pause could limit the USD corrective slide and keep a lid on the XAU/USD pair.
Gold price (XAU/USD) turns positive following an intraday slide to the $3,275-3,274 area as geopolitical risks stemming from the Russia-Ukraine war, the escalation of tensions in the Middle East, and the India-Pakistan border revive safe-haven demand. Apart from this, a modest US Dollar (USD) pullback from a nearly one-month high touched earlier this Friday turns out to be another factor acting as a tailwind for the commodity.
With the intraday move higher, the XAU/USD pair, for now, seems to have snapped a two-day losing streak, though the upside potential seems limited. The optimism led by the US-UK trade deal and the start of US-China negotiations over the weekend remains supportive of a positive risk tone. Furthermore, the Federal Reserve's (Fed) hawkish pause could limit any meaningful USD corrective slide and cap the non-yielding Gold price.
Daily Digest Market Movers: Gold price benefits from reviving safe-haven demand, modest USD downtick
- US President Donald Trump and British Prime Minister Keir Starmer announced a limited bilateral trade deal on Thursday that leaves in place a 10% tariff on goods imported from the UK. Adding to this, US Commerce Secretary Howard Lutnick told CNBC that Washington will roll out dozens of trade deals over the next month, though a 10% tariff imposed on most countries will likely stay.
- Furthermore, the Trump administration is reportedly considering lowering the tariffs on China to 50% from 145% as soon as next week, which adds to the market optimism and might cap the XAU/USD pair. US Treasury Secretary Scott Bessent and US Trade Representative Jamieson Greer are set to meet their Chinese counterparts in Switzerland on Saturday to discuss trade and economic issues.
- The Federal Reserve indicated on Wednesday that it is not leaning towards cutting interest rates anytime soon despite the increasing uncertainty about the economic outlook. Th US Dollar, however, retreats after touching a four-week top during the Asian session on Friday, and benefits the Gold price.
- Russia and Ukraine both reported attacks on their forces on the first day of a three-day unilateral ceasefire called by Russian President Vladimir Putin. Furthermore, Israel’s escalation with Iran-backed Houthis in Yemen and fears of a wider military conflict along the India-Pakistan border keep geopolitical risks in play. This turns out to be another factor acting as a tailwind for the safe-haven precious metal.
- A slew of influential FOMC members are due to speak on Friday. Investors will look for more cues about the Fed's future rate-cut path, which, in turn, will play a key role in driving the USD demand and provide a fresh impetus to the commodity, which remains on track to post modest weekly gains.
Gold price needs to surpass the $3,360-3,365 barrier to support prospects for any further appreciation
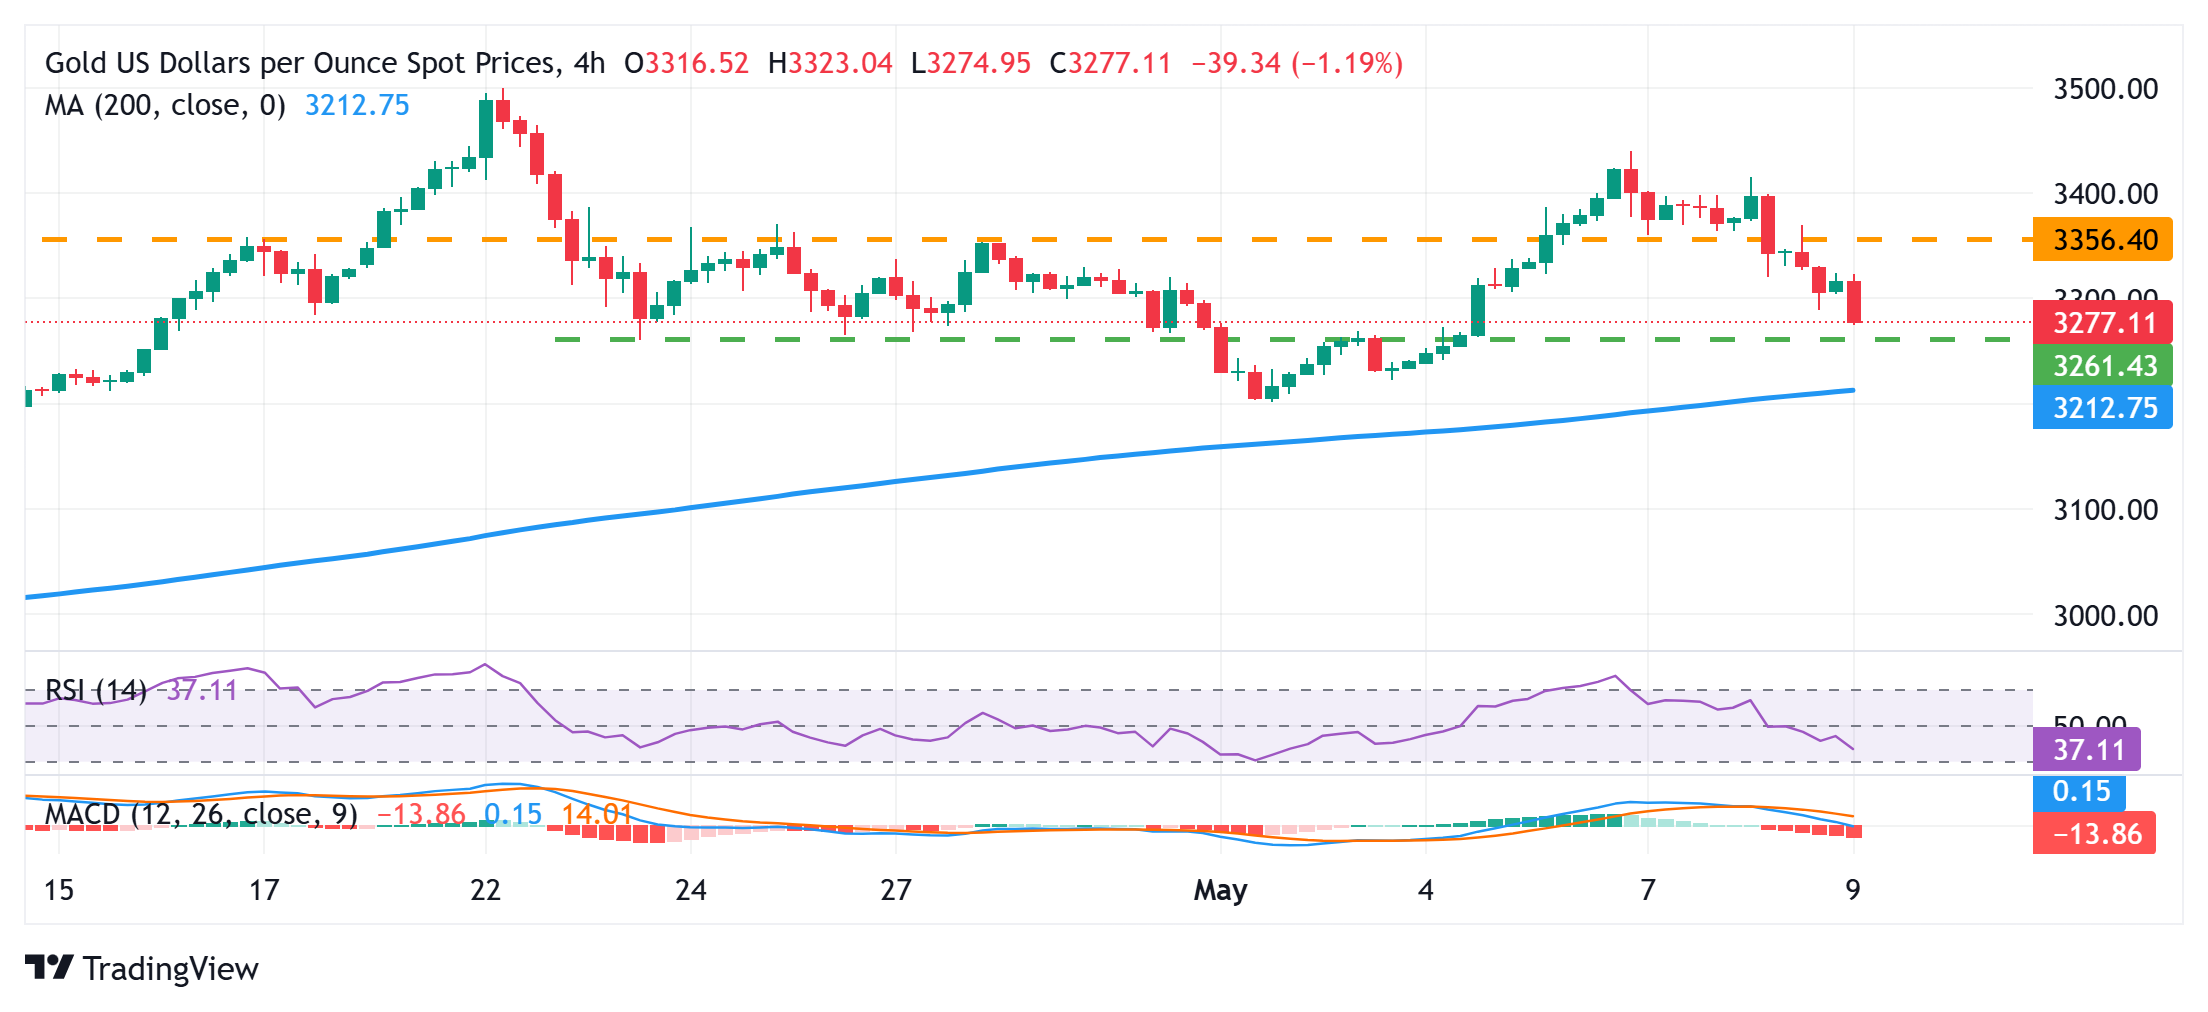
From a technical perspective, the overnight breakdown through the $3,260 resistance-turned-support and the subsequent slide below the $3,300 mark on Friday favors the XAU/USD bears. However, oscillators on the daily chart – though they have been losing traction – are yet to confirm the negative bias. This, in turn, warrants some caution before positioning for deeper losses and suggests that the Gold price could find some support near the $3,265-3,264 horizontal zone. Some follow-through selling, however, should pave the way for a fall towards the $3,223-3,222 intermediate support en route to last week's swing low, around the $3,200 neighborhood.
On the flip side, the Asian session high, around the $3,324 region, now seems to act as an immediate hurdle. Any further move up could attract some sellers and cap the Gold price near the $3,360-3,365 static resistance. A sustained strength beyond the latter should allow the XAU/USD pair to reclaim the $3,400 mark and climb further towards the next relevant hurdle near the $3,434-3,435 area, or the weekly swing high.
US Dollar PRICE Today
The table below shows the percentage change of US Dollar (USD) against listed major currencies today. US Dollar was the strongest against the New Zealand Dollar.
| USD | EUR | GBP | JPY | CAD | AUD | NZD | CHF | |
|---|---|---|---|---|---|---|---|---|
| USD | -0.09% | 0.02% | -0.39% | 0.01% | 0.02% | 0.25% | -0.17% | |
| EUR | 0.09% | 0.10% | -0.31% | 0.09% | 0.11% | 0.33% | -0.09% | |
| GBP | -0.02% | -0.10% | -0.40% | -0.01% | 0.00% | 0.23% | -0.16% | |
| JPY | 0.39% | 0.31% | 0.40% | 0.39% | 0.41% | 0.61% | 0.24% | |
| CAD | -0.01% | -0.09% | 0.00% | -0.39% | 0.00% | 0.24% | -0.15% | |
| AUD | -0.02% | -0.11% | -0.00% | -0.41% | -0.00% | 0.22% | -0.16% | |
| NZD | -0.25% | -0.33% | -0.23% | -0.61% | -0.24% | -0.22% | -0.39% | |
| CHF | 0.17% | 0.09% | 0.16% | -0.24% | 0.15% | 0.16% | 0.39% |
The heat map shows percentage changes of major currencies against each other. The base currency is picked from the left column, while the quote currency is picked from the top row. For example, if you pick the US Dollar from the left column and move along the horizontal line to the Japanese Yen, the percentage change displayed in the box will represent USD (base)/JPY (quote).
Forex News
Keep up with the financial markets, know what's happening and what is affecting the markets with our latest market updates. Analyze market movers, trends and build your trading strategies accordingly.