
Japanese Yen moves away from multi-week low against retreating USD; US NFP eyed for fresh impetus
- The Japanese Yen reverses an Asian session dip to a fresh multi-week low against the USD.
- The BoJ’s dovish outlook and a positive risk tone might cap the upside for the safe-haven JPY.
- Traders might also refrain from placing aggressive bets ahead of the crucial US NFP report.
The Japanese Yen (JPY) builds on its intraday recovery move from a three-week low touched against its American counterpart earlier this Friday. Apart from this, a modest US Dollar (USD) weakness, amid some repositioning trade ahead of the crucial US Nonfarm Payrolls (NFP) report, drags the USD/JPY pair to the 145.00 psychological mark heading into the European session. Any meaningful JPY appreciation, however, seems limited in the wake of the Bank of Japan's (BoJ) dovish pause on Thursday.
In fact, the BoJ slashed its forecasts for economic growth and inflation for the current year amid heightened trade uncertainty, which forced investors to scale back their bets on further interest-rate hikes. This, along with the optimism over the potential de-escalation of the US-China trade war, could act as a headwind for the safe-haven JPY. Traders might also wait for the release of the US employment details, which will influence the USD demand and provide some meaningful impetus to the USD/JPY pair.
Japanese Yen recovers a part of dovish BoJ-inspired heavy losses registered on Thursday
- The Bank of Japan, as was widely anticipated, kept short-term interest rates steady at 0.5% and struck a cautious tone by slashing its growth and inflation forecasts. The central bank expects the Japanese economy to grow 0.5% in the current fiscal year versus its earlier projection of 1.1% in January and revised down its core CPI forecast from 2.4% to 2.2% for fiscal 2025.
- In the post-meeting press conference, BoJ Governor Kazuo Ueda said that the uncertainty from trade policies heightened sharply and the timing to achieve the 2% inflation goal will be somewhat delayed. This forced investors to trim their bets for the next BoJ rate hike in June or July and dragged the Japanese Yen to a three-week low against the US Dollar on Friday.
- The BoJ, however, reiterated that it remains committed to raising interest rates further if the economy and prices move in line with its forecasts. This, to a larger extent, offsets the latest optimism fueled by hopes for US-China trade negotiations and assists the JPY to attract some intraday buyers.
- China's state media said on Thursday that US President Donald Trump's administration had used various channels to contact Beijing and had been seeking to initiate tariff negotiations. The statement follows Trump's assertions that conversations between the two nations were already underway – a claim that China has publicly denied repeatedly.
- Japan's Finance Minister Katsunobu Kato said this Friday that the country's $1 trillion-plus in US Treasury holdings are among the tools available to use in trade negotiations with the US. Kato also said his meeting with US Treasury Secretary Scott Bessent last week did not discuss any desirable level of exchange rates or a possible framework to control currency moves.
- On the economic data front, a report published by Japan's Statistics Bureau earlier today showed that the Unemployment Rate edged up to 2.5% in March from 2.4% in the previous month. However, Japan's average Unemployment Rate in fiscal 2024 fell 0.1% from a year earlier, to 2.5%, marking the first improvement in two years on the back of a labor shortage.
- From the US, the Department of Labor reported on Thursday that initial jobless claims increased from 223,000 to 241,000 in the week ended April 26 – marking the highest level since February. Moreover, the US ISM Manufacturing PMI remained firmly in contraction territory for the second straight month, though it fell less than expected, from 49.0 to 48.7 in April.
- This comes on top of the disappointing US ADP report on private-sector employment and points to signs of a cooling labor market. Adding to this, a surprise contraction in the US GDP for the first time since 2022 and easing inflationary pressures continue to fuel speculations for more interest-rate cuts by the Federal Reserve later this year.
- The US Dollar, however, seems unaffected and looks to build on a three-day-old uptrend to a three-week top, which, in turn, pushes the USD/JPY pair to the 146.00 neighborhood during the Asian session on Friday. Traders now look forward to the closely-watched US Nonfarm Payrolls report for cues about the Fed's policy outlook and some meaningful impetus.
USD/JPY is more likely to attract some dip-buyers near the 144.30-144.25 pivotal support
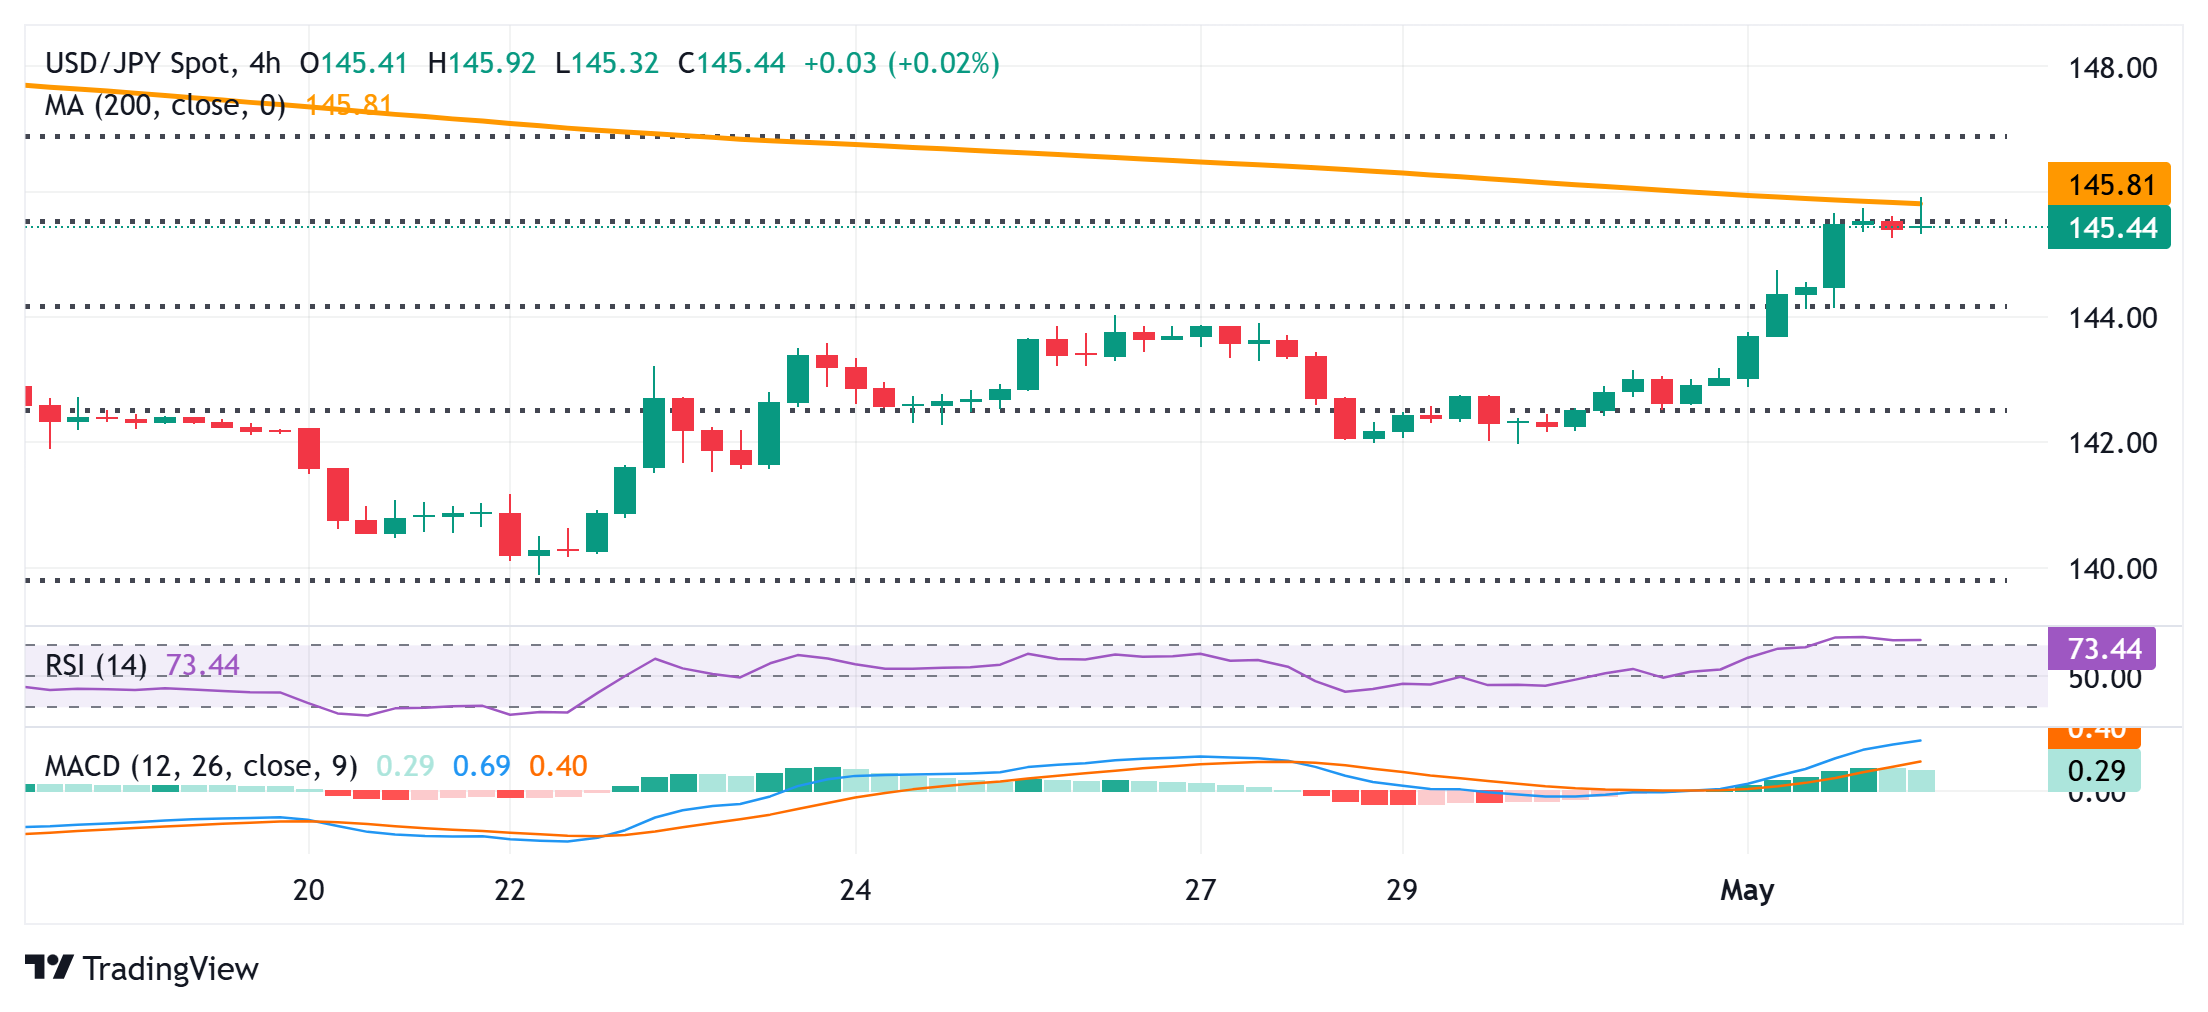
From a technical perspective, the overnight breakout above the 38.2% Fibonacci retracement level of the March-April downfall and the 145.00 psychological mark was seen as a key trigger for bullish traders. Moreover, oscillators on the daily chart have just started gaining positive traction and suggest that the path of least resistance for the USD/JPY pair is to the upside. The subsequent move up beyond the 50% Fibo. level, however, stalls near the 200-period Simple Moving Average (SMA) on the 4-hour chart.
This makes it prudent to wait for some follow-through buying beyond the 146.00 mark before positioning for an extension of the recent goodish recovery move from a multi-month low. Spot prices might then climb to the 146.55-146.60 intermediate resistance before aiming to test the 61.8% Fibo. level, around the 147.00 neighborhood.
On the flip side, the 145.25 area could offer immediate support ahead of the 145.00 round figure. Any further corrective slide might now be seen as a buying opportunity and remain limited near the 144.30-144.25 region, or the 38.2% Fibo. level. A convincing break below the latter, however, might prompt some technical selling and drag the USD/JPY pair below the 144.00 mark, towards the mid-143.00s en route to the 143.20 area and eventually to sub-143.00 levels.
US Dollar PRICE Today
The table below shows the percentage change of US Dollar (USD) against listed major currencies today. US Dollar was the strongest against the Japanese Yen.
| USD | EUR | GBP | JPY | CAD | AUD | NZD | CHF | |
|---|---|---|---|---|---|---|---|---|
| USD | -0.27% | -0.23% | -0.10% | -0.33% | -0.48% | -0.47% | -0.16% | |
| EUR | 0.27% | 0.05% | 0.20% | -0.05% | -0.18% | -0.17% | 0.12% | |
| GBP | 0.23% | -0.05% | 0.14% | -0.10% | -0.24% | -0.21% | 0.08% | |
| JPY | 0.10% | -0.20% | -0.14% | -0.25% | -0.38% | -0.37% | -0.05% | |
| CAD | 0.33% | 0.05% | 0.10% | 0.25% | -0.16% | -0.12% | 0.17% | |
| AUD | 0.48% | 0.18% | 0.24% | 0.38% | 0.16% | 0.03% | 0.32% | |
| NZD | 0.47% | 0.17% | 0.21% | 0.37% | 0.12% | -0.03% | 0.29% | |
| CHF | 0.16% | -0.12% | -0.08% | 0.05% | -0.17% | -0.32% | -0.29% |
The heat map shows percentage changes of major currencies against each other. The base currency is picked from the left column, while the quote currency is picked from the top row. For example, if you pick the US Dollar from the left column and move along the horizontal line to the Japanese Yen, the percentage change displayed in the box will represent USD (base)/JPY (quote).
Forex News
Keep up with the financial markets, know what's happening and what is affecting the markets with our latest market updates. Analyze market movers, trends and build your trading strategies accordingly.