USD/INR appreciates due to expiration of monthly futures contracts
- The Indian Rupee depreciates as the demand for US Dollar emerges due to expiration of monthly currency futures contracts.
- Indian bonds are scheduled to be included in the JP Morgan Emerging Market Bond Index on June 28.
- Higher crude prices limit the upside of the INR as India is the world's third-largest Oil consumer.
The Indian Rupee (INR) loses ground as the demand for the US Dollar emerges, which could be attributed to the expiration of monthly currency futures contracts. However, the INR may limit its downside due to expectations of foreign inflows, as Indian bonds are set to enter the JP Morgan Emerging Market (EM) Bond Index on June 28.
The US Dollar extends its gains on Tuesday, supported by the advance of the US Treasury yields. The recent comments by Federal Reserve (Fed) officials indicated that the central bank is not in a rush to start its rate-cutting cycle.
Investors await key US economic data releases later this week. The revised US Gross Domestic Product (GDP) for the first quarter (Q1) is scheduled to be released on Thursday, followed by the Personal Consumption Expenditures (PCE) Price Index on Friday.
Daily Digest Market Movers: Indian Rupee may limit its downside due to expected foreign inflows
- Foreign investors have already invested approximately $10 billion into the securities eligible to join JPMorgan’s index on June 28, according to Business Standard. Meanwhile, Goldman Sachs anticipates at least $30 billion more in inflows in the coming months as India’s weighting on the index steadily rises to 10%.
- The rise in crude oil prices, driven by expectations of strong summer driving demand, could pressure the Indian Rupee. As the world's third-largest oil consumer after the United States and China, India is significantly impacted by fluctuations in oil prices.
- Reuters cited Fed Governor Michelle Bowman repeating her view on Tuesday that holding the policy rate steady for some time will likely be enough to bring inflation under control. Meanwhile, Fed Governor Lisa Cook said it would be appropriate to cut interest rates "at some point" given significant progress on inflation and a gradual cooling of the labor market, though she remained vague about the timing of the easing.
- The S&P Global Ratings retained its growth forecast for India at 6.8% for FY25, citing high interest rates and government spending boosting demand in the non-agricultural sectors.
- RBI Governor Shaktikanta Das stated on Tuesday that India is on the verge of a major structural shift in its growth trajectory, moving towards sustained 8% GDP growth. Das attributes this growth to several key drivers, including structural reforms such as the Goods and Services Tax (GST), reported by The Economic Times.
- India is expected to become a $4 trillion economy in 2025, surpassing Japan by early next fiscal year to become the world's fourth largest economy, according to Indian Economic Advisory Council to the Prime Minister (EAC-PM) member Sanjeev Sanyal.
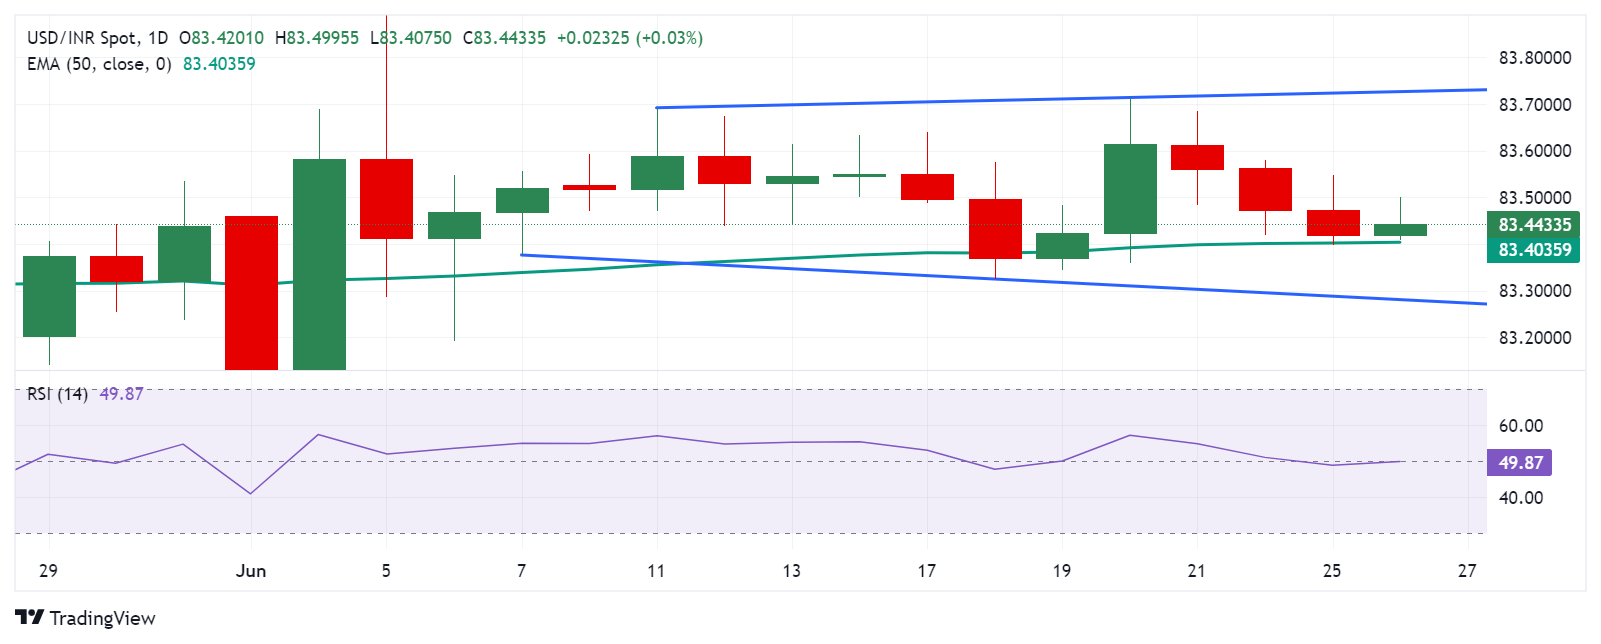
Technical analysis: USD/INR hovers around the level of 83.50
The USD/INR trades around 83.50 on Wednesday. The daily chart analysis shows a broadening pattern, representing increasing volatility. This chart pattern suggests a potential correction before moving lower. The 14-day Relative Strength Index (RSI) is positioned below the 50 level, indicating a bearish bias.
The immediate support appears at the 50-day Exponential Moving Average (EMA) at 83.40. A break below this level could exert pressure on the USD/INR pair to navigate the region around the lower boundary of the broadening bottom around the level of 83.30.
On the upside, the USD/INR pair may find resistance at the upper boundary of the broadening formation around the level of 83.70, followed by the psychological level of 84.00.
USD/INR: Daily Chart
US Dollar price today
The table below shows the percentage change of the US Dollar (USD) against listed major currencies today. The US Dollar was the strongest against the Euro.
| USD | EUR | GBP | CAD | AUD | JPY | NZD | CHF | |
| USD | 0.22% | 0.09% | 0.03% | -0.49% | 0.13% | 0.15% | 0.08% | |
| EUR | -0.21% | -0.11% | -0.19% | -0.70% | -0.06% | -0.08% | -0.13% | |
| GBP | -0.09% | 0.12% | -0.08% | -0.58% | 0.05% | 0.02% | -0.02% | |
| CAD | -0.03% | 0.19% | 0.07% | -0.49% | 0.12% | 0.13% | 0.06% | |
| AUD | 0.49% | 0.69% | 0.54% | 0.50% | 0.63% | 0.62% | 0.56% | |
| JPY | -0.14% | 0.07% | -0.05% | -0.13% | -0.60% | 0.00% | -0.06% | |
| NZD | -0.15% | 0.08% | -0.04% | -0.11% | -0.62% | -0.02% | -0.04% | |
| CHF | -0.08% | 0.13% | 0.02% | -0.06% | -0.54% | 0.06% | 0.08% |
The heat map shows percentage changes of major currencies against each other. The base currency is picked from the left column, while the quote currency is picked from the top row. For example, if you pick the Euro from the left column and move along the horizontal line to the Japanese Yen, the percentage change displayed in the box will represent EUR (base)/JPY (quote).
Indian economy FAQs
The Indian economy has averaged a growth rate of 6.13% between 2006 and 2023, which makes it one of the fastest growing in the world. India’s high growth has attracted a lot of foreign investment. This includes Foreign Direct Investment (FDI) into physical projects and Foreign Indirect Investment (FII) by foreign funds into Indian financial markets. The greater the level of investment, the higher the demand for the Rupee (INR). Fluctuations in Dollar-demand from Indian importers also impact INR.
India has to import a great deal of its Oil and gasoline so the price of Oil can have a direct impact on the Rupee. Oil is mostly traded in US Dollars (USD) on international markets so if the price of Oil rises, aggregate demand for USD increases and Indian importers have to sell more Rupees to meet that demand, which is depreciative for the Rupee.
Inflation has a complex effect on the Rupee. Ultimately it indicates an increase in money supply which reduces the Rupee’s overall value. Yet if it rises above the Reserve Bank of India’s (RBI) 4% target, the RBI will raise interest rates to bring it down by reducing credit. Higher interest rates, especially real rates (the difference between interest rates and inflation) strengthen the Rupee. They make India a more profitable place for international investors to park their money. A fall in inflation can be supportive of the Rupee. At the same time lower interest rates can have a depreciatory effect on the Rupee.
India has run a trade deficit for most of its recent history, indicating its imports outweigh its exports. Since the majority of international trade takes place in US Dollars, there are times – due to seasonal demand or order glut – where the high volume of imports leads to significant US Dollar- demand. During these periods the Rupee can weaken as it is heavily sold to meet the demand for Dollars. When markets experience increased volatility, the demand for US Dollars can also shoot up with a similarly negative effect on the Rupee.
Forex News
Keep up with the financial markets, know what's happening and what is affecting the markets with our latest market updates. Analyze market movers, trends and build your trading strategies accordingly.