
Gold price drops to multi-day low, around $3,320 area amid notable USD buying
- Gold price attracts heavy intraday selling and turns lower for the second successive day.
- The Fed’s hawkish pause underpins the USD and weighs on the non-yielding commodity.
- A positive risk tone also exerts pressure on the XAU/USD pair ahead of Trump's presser.
Gold price (XAU/USD) turns lower for the second straight day following an intraday uptick to the $3,414-3,415 area and extends the intraday descent heading into the European session on Thursday. The US Dollar (USD) attracts some follow-through buying in the wake of the Federal Reserve's (Fed) hawkish pause on Wednesday, which, in turn, is seen as a key factor weighing on the non-yielding yellow metal. Apart from this, a generally positive tone around the equity markets contributes to driving flows away from the precious metal.
Meanwhile, US President Donald Trump tempered hopes for a quick resolution to the US-China trade war by saying that he is in no real hurry to sign any deals. Furthermore, persistent geopolitical risks stemming from the Russia-Ukraine war, conflicts in the Middle East, and a dangerous military confrontation on the India-Pakistan border could act as a tailwind for the safe-haven Gold price. Traders might also refrain from placing aggressive directional bets and opt to wait for Trump's press conference later today, at 14:00 GMT.
Daily Digest Market Movers: Gold price is weighed down by hawkish Fed-inspired modest USD strength
- US President Donald Trump said on Wednesday that he was not open to lowering the 145% tariffs imposed on China in order to encourage trade-war negotiations. This keeps a lid on the optimism led by the announcement of US-China trade talks later this week and provides a modest intraday lift to the safe-haven Gold price.
- Airports were shut down across Moscow amid a massive Ukrainian drone attack ahead of Russian President Vladimir Putin’s unilaterally announced three-day truce. Furthermore, Ukraine said that Russia had launched guided bombs nearly three hours after the ceasefire came into force earlier this Thursday.
- Meanwhile, the Israeli military said that it had fully disabled Yemen's main airport in the capital, Sanaa, which is controlled by the Houthis. In response, a member of the Houthis' top political body said that the response to Israel's attacks is coming. This keeps geopolitical risks in play and could underpins the XAU/USD pair.
- The Federal Reserve, as was widely expected, held its key interest rate unchanged in a range between 4.25%-4.5% at the end of a two-day monetary policy meeting on Wednesday. In the accompanying statement, the US central bank noted that the uncertainty about the economic outlook has increased further.
- In the post-meeting press conference, Fed Chair Jerome Powell also noted that there is a great deal of uncertainty about tariffs and said that the right thing to do is wait for further clarity. This suggests that the US central bank is not leaning toward cutting rates anytime soon, lending some support to the US Dollar.
- Trump said on Truth Social that he will announce a major trade deal, the first of many, with representatives of a big and highly respected country on Thursday. This remains supportive of a generally positive risk tone around the equity markets and could act as a headwind for the precious metal.
- The market focus will remain glued to Trump's press conference at 14 GMT in the Oval Office. Apart from this, Thursday's release of the US Weekly Initial Jobless Claims data will influence the USD price dynamics and provide a fresh impetus to the XAU/USD pair later during the North American session.
Gold price could weaken further; $3,300 round-figure mark holds the key for bullish traders
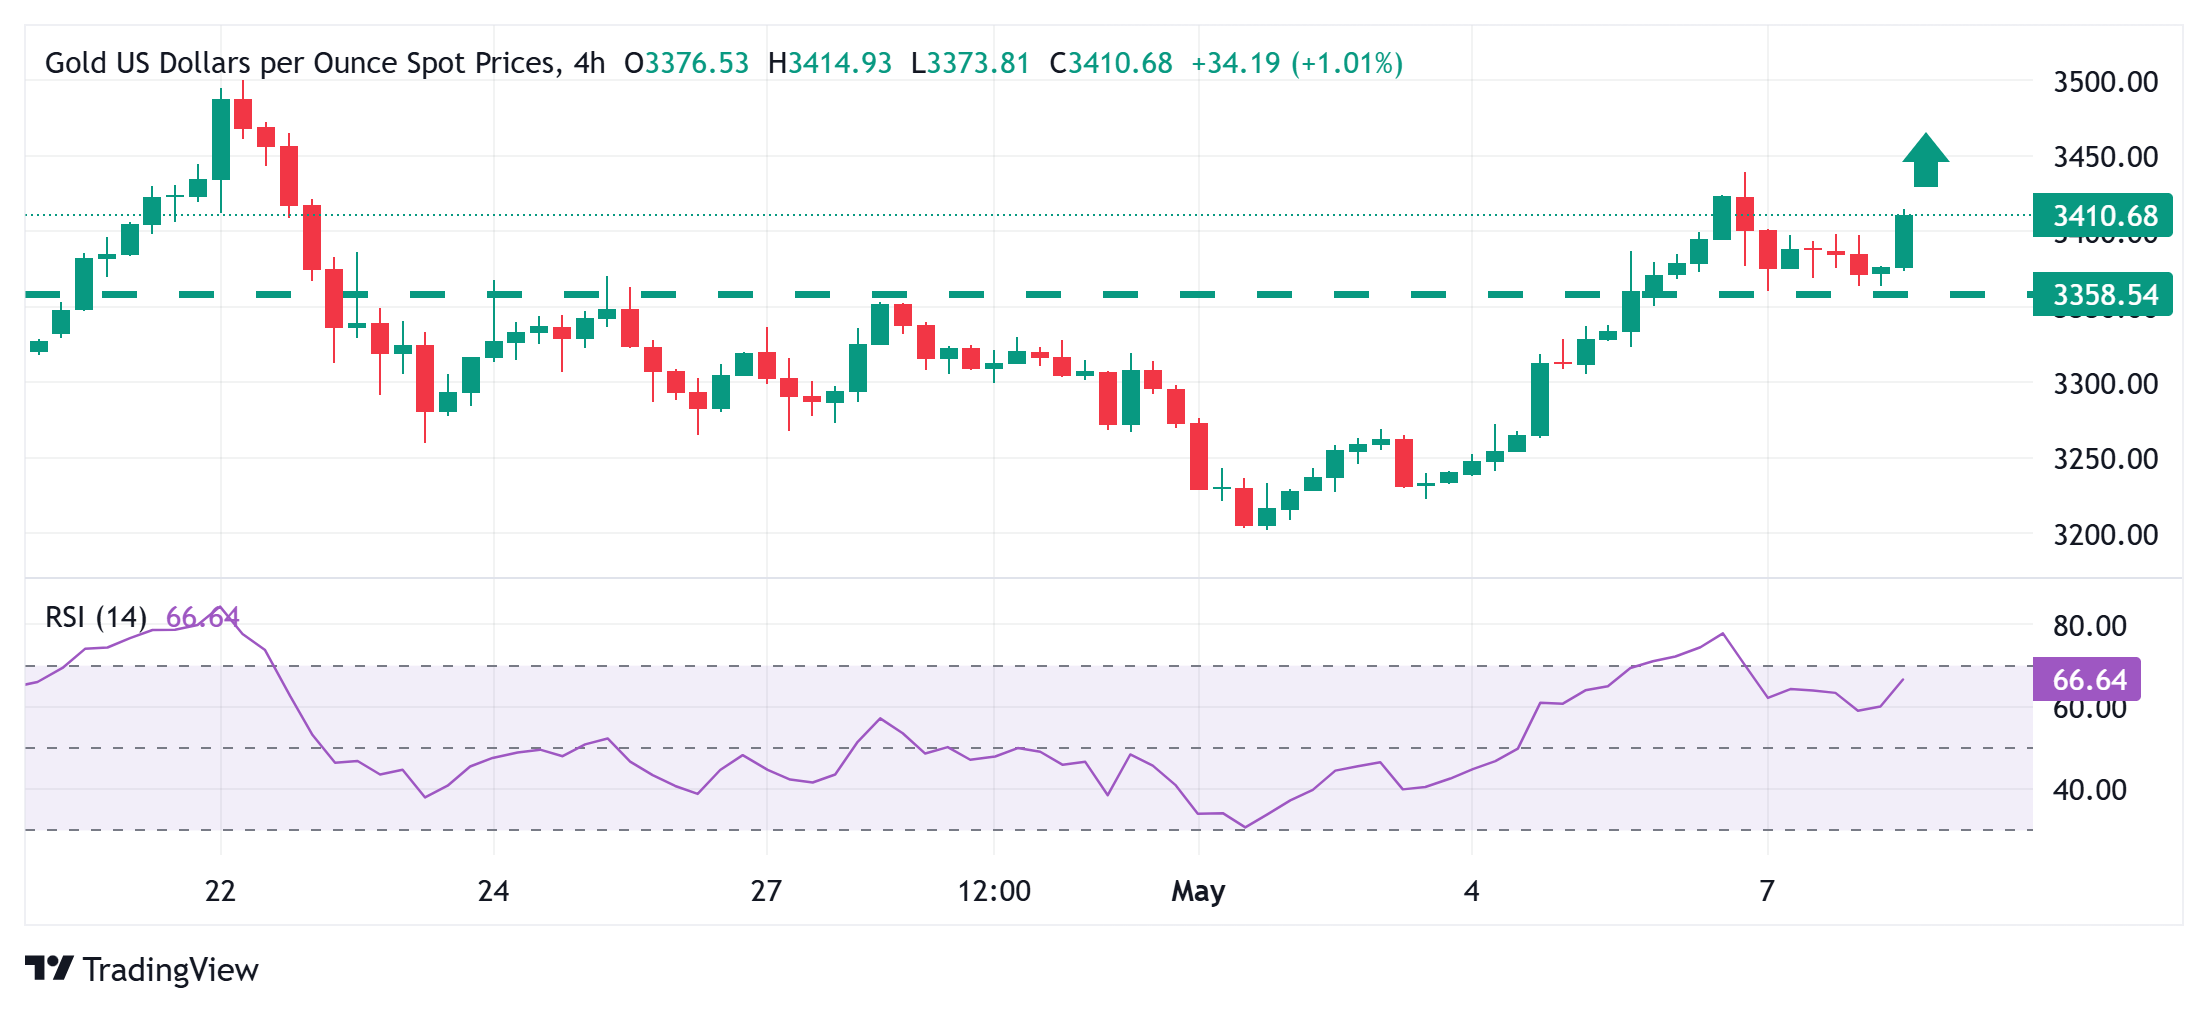
From a technical perspective, the emergence of fresh buying near the $3,260 resistance-turned-support and the subsequent move up favors the XAU/USD bulls. Moreover, oscillators on the daily chart are holding comfortably in positive territory, suggesting that the path of least resistance for the Gold price remains to the upside. Some follow-through buying beyond the $3,434-3,435 region, or the weekly high, will reaffirm the positive bias and allow the commodity to retest the all-time peak and make a fresh attempt to conquer the $3,500 psychological mark.
On the flip side, any further decline might now find some support near the $3,300 round figure. A convincing break below the said handle would negate the near-term positive outlook and prompt some technical selling. The downward trajectory might then drag the Gold price to the $3,265-3,260 intermediate support en route to the $3,223-3,222 region and the last week's swing low, around the $3,200 neighborhood.
US Dollar PRICE Today
The table below shows the percentage change of US Dollar (USD) against listed major currencies today. US Dollar was the strongest against the Swiss Franc.
| USD | EUR | GBP | JPY | CAD | AUD | NZD | CHF | |
|---|---|---|---|---|---|---|---|---|
| USD | 0.21% | 0.13% | 0.42% | 0.29% | 0.26% | 0.29% | 0.56% | |
| EUR | -0.21% | -0.07% | 0.20% | 0.06% | 0.06% | 0.09% | 0.35% | |
| GBP | -0.13% | 0.07% | 0.31% | 0.14% | 0.15% | 0.15% | 0.40% | |
| JPY | -0.42% | -0.20% | -0.31% | -0.14% | -0.15% | -0.13% | 0.10% | |
| CAD | -0.29% | -0.06% | -0.14% | 0.14% | -0.03% | 0.00% | 0.23% | |
| AUD | -0.26% | -0.06% | -0.15% | 0.15% | 0.03% | 0.03% | 0.26% | |
| NZD | -0.29% | -0.09% | -0.15% | 0.13% | -0.00% | -0.03% | 0.23% | |
| CHF | -0.56% | -0.35% | -0.40% | -0.10% | -0.23% | -0.26% | -0.23% |
The heat map shows percentage changes of major currencies against each other. The base currency is picked from the left column, while the quote currency is picked from the top row. For example, if you pick the US Dollar from the left column and move along the horizontal line to the Japanese Yen, the percentage change displayed in the box will represent USD (base)/JPY (quote).
Forex News
Keep up with the financial markets, know what's happening and what is affecting the markets with our latest market updates. Analyze market movers, trends and build your trading strategies accordingly.