
NZD/USD Price Analysis: Could break into the symmetrical triangle, rises to near 0.5950
- NZD/USD extends gains despite the prevailing bearish sentiment for the pair.
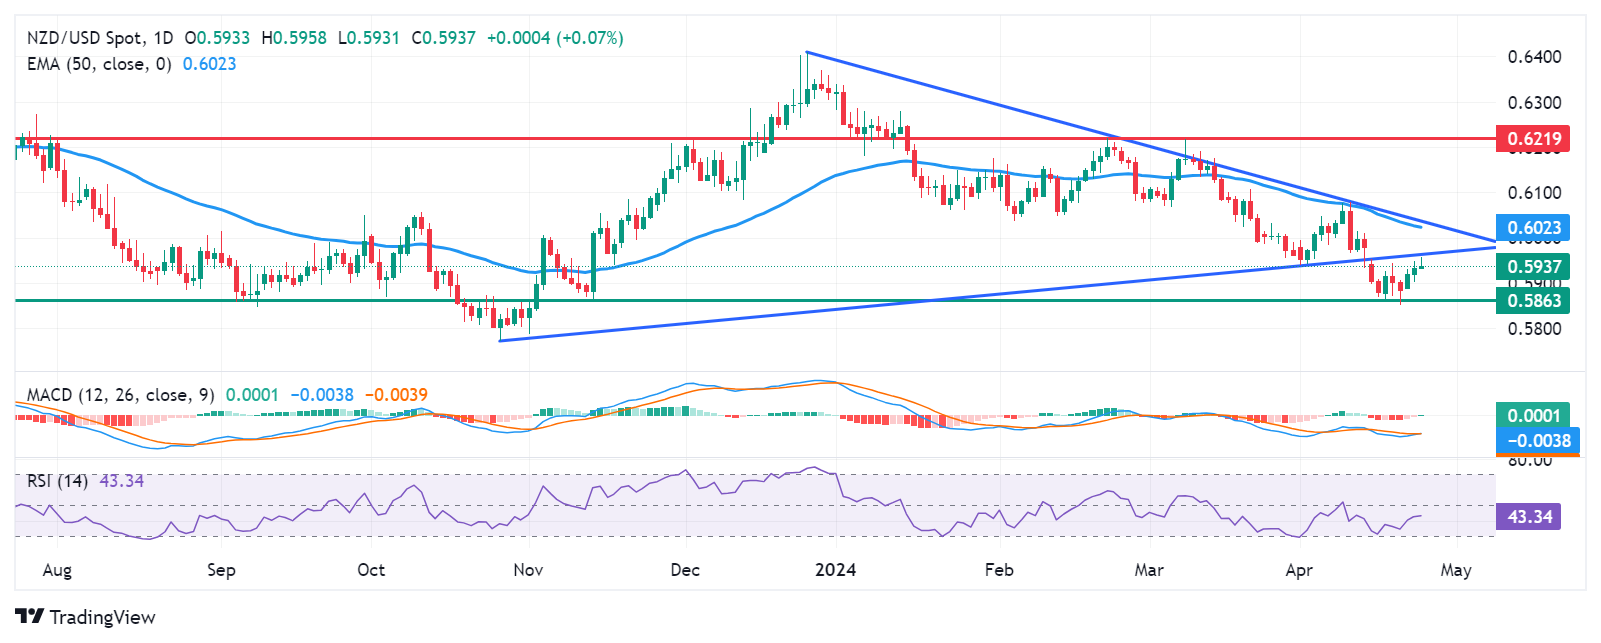
- A break below 0.5900 could lead the pair to test the rebound support level of 0.5863.
- A break into the triangle around the level of 0.5963 has the potential to weaken the bearish sentiment.
NZD/USD advances for the third consecutive session on Wednesday, trading around 0.5940 during the European session. The pair is testing the lower boundary of the daily symmetrical triangle around the level of 0.5963. A breach into the triangle could potentially weaken the bearish sentiment.
However, analysis of the lagging indicator Moving Average Convergence Divergence (MACD) suggests a downward trend for the NZD/USD pair. This is indicated by the placement of the MACD line below the centerline and the signal line.
Additionally, the 14-day Relative Strength Index (RSI) remains below the 50 level, further confirming the bearish sentiment. This could prompt NZD/USD to approach the psychological level of 0.5900. A break below this level may lead the pair to test the rebound support region around the levels of 0.5863 and 0.5850.
Alternatively, If the NZD/USD pair breaks into the symmetrical triangle, it might target the psychological barrier of 0.6000. A breakthrough above this level could support the pair's momentum to test the 50-day Exponential Moving Average (EMA) at 0.6023, which aligns with the upper boundary of the triangle around 0.6030.
NZD/USD: Daily Chart
Forex News
Keep up with the financial markets, know what's happening and what is affecting the markets with our latest market updates. Analyze market movers, trends and build your trading strategies accordingly.