USD/JPY pauses near resistance as breakout decision looms
- USD/JPY hovers below key resistance as momentum shows signs of stalling.
- The pair is pressured by mixed Fed and BoJ signals.
- Range-bound price action continues; breakout or breakdown expected soon.
The USD/JPY pair remains a focal point in the foreign exchange market, fluctuating within a key technical zone as markets digest evolving economic and monetary policy expectations.
With the US Dollar (USD) trading at 145.13, down 0.47%, against the Japanese Yen (JPY) at the time of writing, the recent three-week rally is showing signs of fatigue, with this week’s price action reflecting indecision amid mixed sentiment.
While inflation has shown signs of cooling, Federal Reserve (Fed) officials have maintained a cautious tone, limiting the potential for aggressive rate cuts in the near term. Meanwhile, the Japanese Yen continues to be weighed down by the Bank of Japan’s (BoJ) ultra-loose policy stance, though recent verbal intervention from Japanese officials has introduced volatility into Yen pairs.
Risk sentiment and Treasury yields also remain central to USD/JPY directionality.
Daily momentum stalls below resistance as USD/JPY consolidates near 145.00
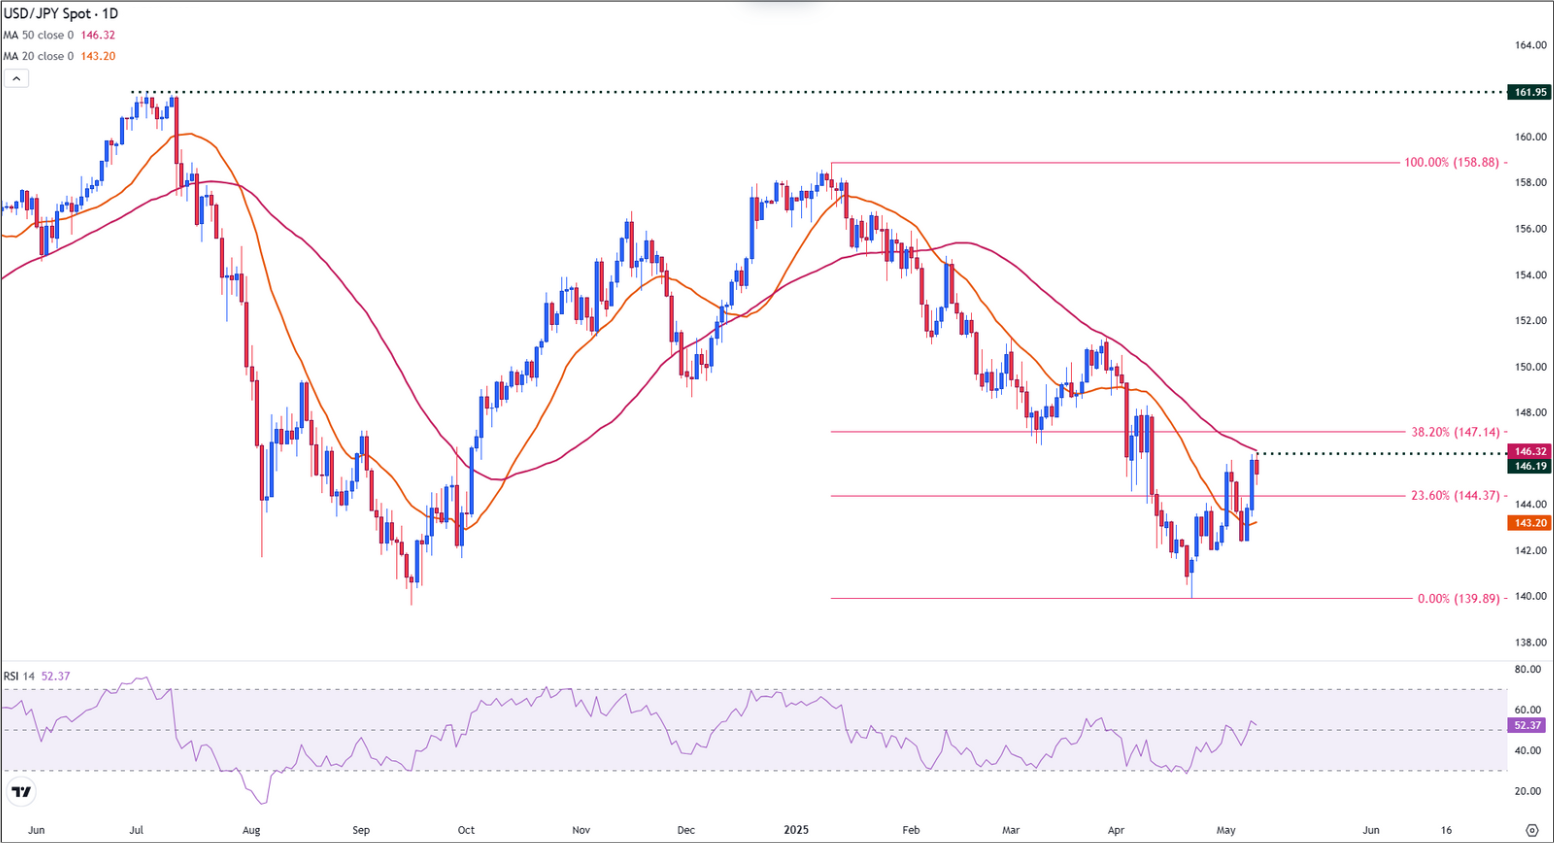
On the daily chart, USD/JPY extended its recovery in the middle of the week, pushing above the 20-Day Simple Moving Average (SMA) at 143.19 and reclaiming the 144.00 psychological level, which had previously acted as resistance.
This move was reinforced by a break above the 23.6% Fibonacci retracement level at 144.37, measured from the YTD January high to the April low, allowing the pair to reach a high of 146.19 on Friday.
However, bullish momentum faded near the 50-day SMA at 146.34, where price met strong resistance.
The failure to maintain levels above 146.00 led to a pullback and stabilization around the 145.00 handle, positioning the pair within a critical zone defined by short-term moving averages.
This area between the 20-day and 50-day SMA represents a compression of price action that could precede a breakout in either direction.
The Relative Strength Index (RSI) has climbed modestly to 52.37, indicating a slight bullish tilt in momentum, though it remains within neutral territory and lacks overbought conditions.
USD/JPY daily chart
Weekly Spinning Top signals indecision for USD/JPY
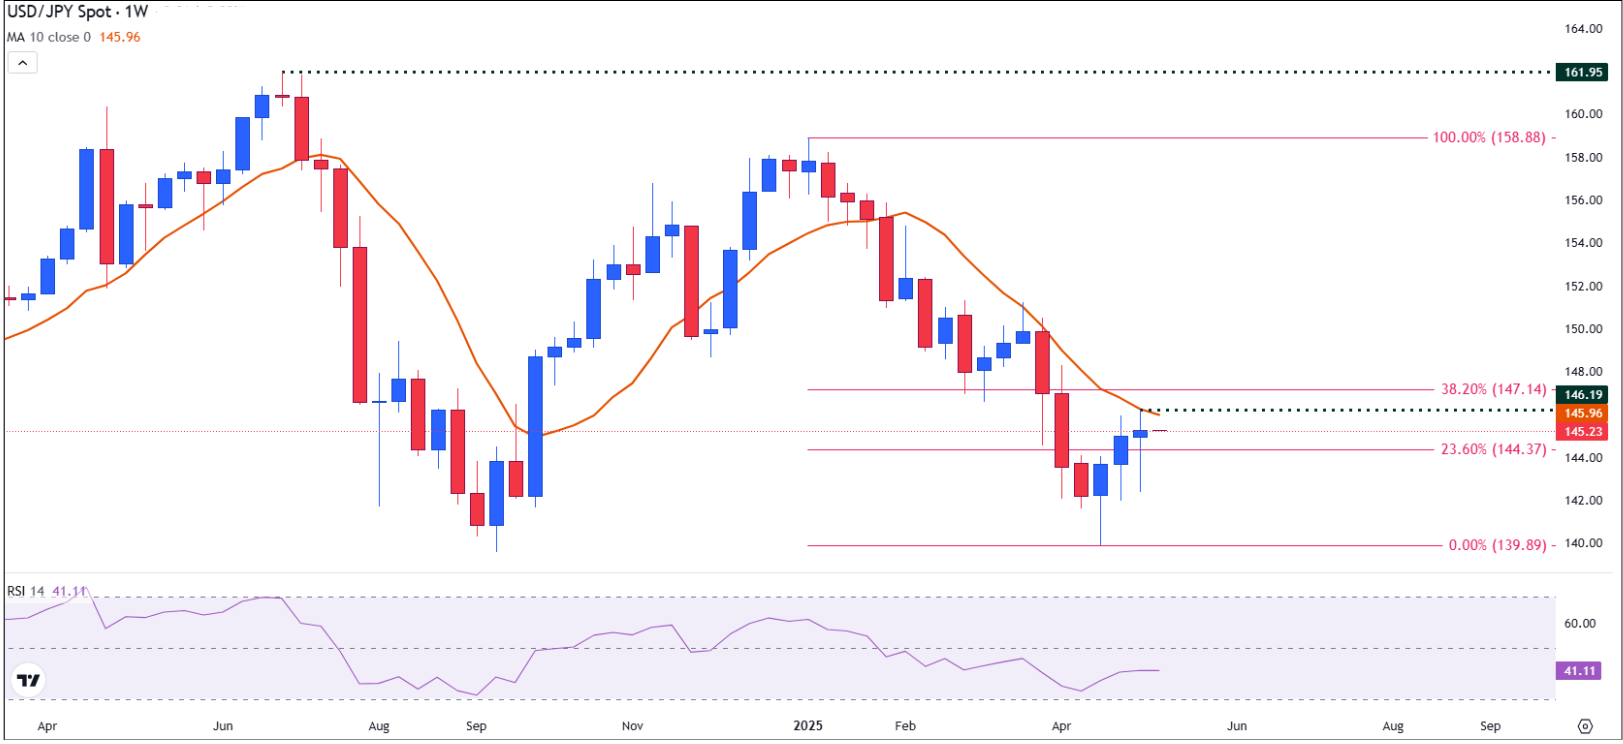
Taking a broader view, the weekly chart reflects a maturing rally, with USD/JPY posting its third consecutive weekly gain before meeting resistance.
This shift in momentum is illustrated by a spinning top candlestick, a classic signal of market indecision and potential trend exhaustion.
The long upper shadow highlights rejection near the 146.19 high, while the long lower shadow points to sustained dip-buying interest below 144.00, a psychological and technical significance level.
Resistance remains concentrated at the 10-week SMA (145.96) and the 50-day SMA, both of which limited further upside this week.
Support is well-defined between the 23.6% Fibonacci retracement at 144.37 and the 20-day SMA at 143.19, reflecting an area where buying interest has repeatedly emerged. The convergence of signals across timeframes indicates that while the broader trend remains constructive, momentum has paused, and the upcoming weekly close will be key in shaping the medium-term trajectory.
On the weekly chart, the RSI currently reads at 40.97, reflecting subdued momentum and a lack of conviction in the broader trend, with the indicator still below the neutral 50 line.
USD/JPY weekly chart
USD/JPY at inflection point as breakout or breakdown set to define next move
A confirmed breakout above the 50-day SMA (146.34) would signal a resumption of bullish momentum in USD/JPY, opening the path toward the next resistance at 147.09, the 38.2% retracement of the January–April decline.
Sustained buying beyond this point could target the psychological 150.00 level, especially if US Treasury yields remain firm, economic data stays resilient, or policy divergence between the Fed and BoJ persists.
Conversely, failure to hold above 144.37 followed by a decisive break below the 20-day SMA would suggest fading bullish momentum, shifting focus toward 142.00 and potentially 140.00, particularly if risk sentiment weakens or US data disappoints.
Forex News
Keep up with the financial markets, know what's happening and what is affecting the markets with our latest market updates. Analyze market movers, trends and build your trading strategies accordingly.