US Dollar Index stuck while recession and stagflation fears resurface
- The US Dollar trades flat against most major currencies.
- The initial reading of the US GDP for the first quarter turns negative.
- The US Dollar Index is capped below the 100.00 round level ahead of key US data.
The US Dollar Index (DXY), which tracks the performance of the US Dollar (USD) against six major currencies, trades flat at 99.30 at the time of writing on Wednesday. The Greenback is not really going anywhere as investors stay on the sidelines against key data releases during the American session. United States (US) President Donald Trump signed an executive order to ease the tariff impact on car parts and, during a rally in Detroit, lashed out at Federal Reserve Chairman Jerome Powell again, proclaiming Trump knows more about interest rates than Powell does.
On the economic calendar front, a general rehearsal will take place this Wednesday ahead of the Nonfarm Payrolls release on Friday. The US Gross Domestic Product (GDP) preliminary reading for Q1 will already be a vital element to assess the first impact, if any, of the administration’s tariff policy. And that reading was a very bearish print, with GDP falling into contraction by -0.3%, missing the positive 0.4% expected.
Daily digest market movers: Reality kicking in
- The preliminary reading of the first quarter for US Gross Domestic Product saw the annualized rate fall into contraction by 0.3%, missing the growth forecast of 0.4% and much slower than the 2.4% expansion seen in 2024’s fourth quarter. The Personal Consumption Expenditures (PCE) component under the quarterly reading revealed upside pressure in price with the headline PCE reading coming in at 3.6%, from 2.4% in the last quarter of 2024. Core PCE came in red hot at 3.5%, from 2.6% in the previous quarter. This could even be perceived as stagflation.
- The Chicago Purchasing Manager’s Index for April falls further in contraction and comes in at 44.6, missing the expected 45.5 and further down from 47.6.
- The Monthly Core PCE came in at 0.0%, missing the 0.1%, down from 0.4%. The monthly headline number fell to 0.0% as expected, coming from 0.3% previously.
- Equities dive lower with the Nasdaq down over 2.0%. European equities are being torn into negative numbers as well just hours before the European closing bell.
- The CME FedWatch tool shows the chance of an interest rate cut by the Federal Reserve in the May’s meeting stands at 7.6% against a 92.4% probability of no change. The June meeting sees a 65.1% chance of a rate cut.
- The US 10-year yields trade around 4.16%, dipping lower again on rate cut bets with US data deteriorating and the Fed needed to cut rates.
US Dollar Index Technical Analysis: Keeping dry until Friday
The US Dollar Index (DXY) is starting to pick up from its low levels of 2025. Bulls are slowly starting to take back control of the chart. However, risk elements persist with the uncertainty and possible further deterioration of US data likely to cause the DXY to edge substantially lower.
On the upside, the DXY’s first resistance comes in at 100.22, which supported the DXY back in September 2024, with a break back above the 100.00 round level as a bullish signal. A firm recovery would be a return to 101.90, which acted as a pivotal level throughout December 2023 and again as a base for the inverted head-and-shoulders (H&S) formation during the summer of 2024.
On the other hand, the 97.73 support could quickly be tested on any substantial bearish headline. Further below, a relatively thin technical support comes in at 96.94 before looking at the lower levels of this new price range. These would be at 95.25 and 94.56, meaning fresh lows not seen since 2022.
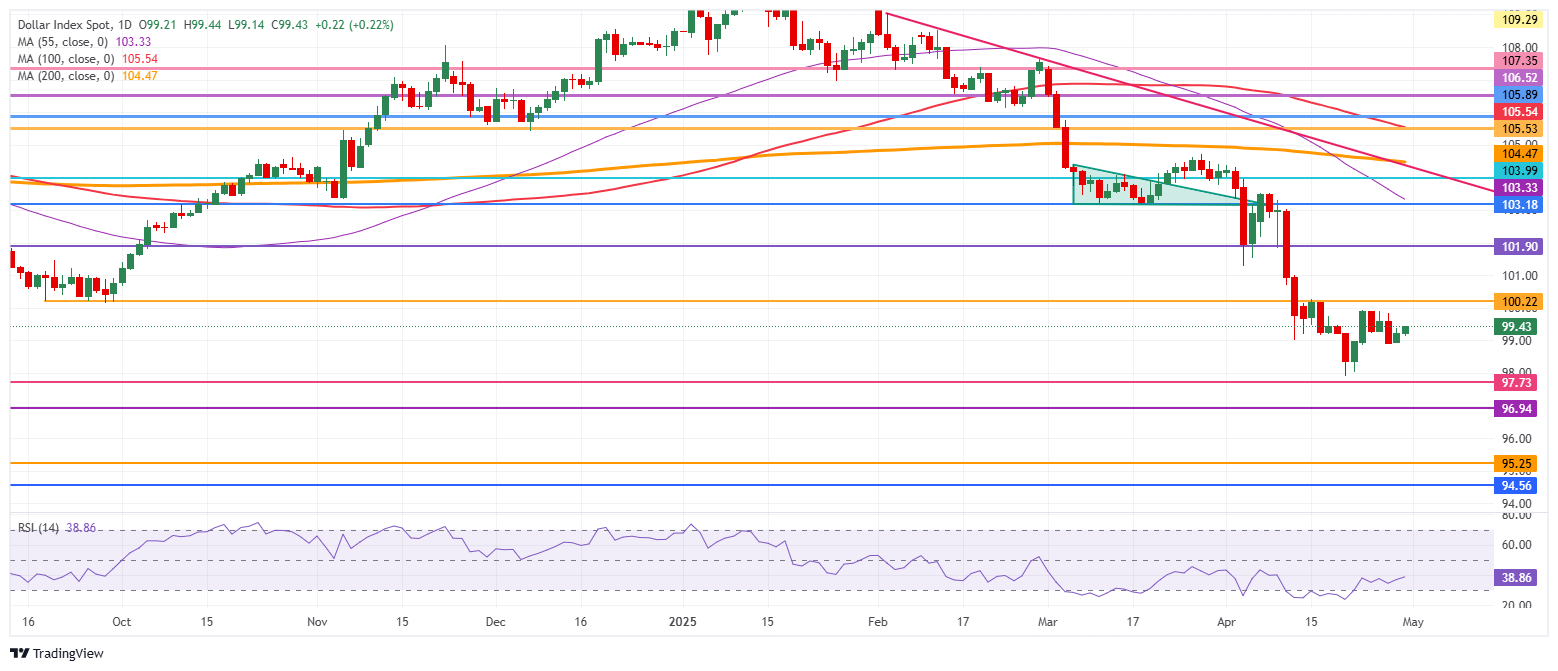
US Dollar Index: Daily Chart
Inflation FAQs
Inflation measures the rise in the price of a representative basket of goods and services. Headline inflation is usually expressed as a percentage change on a month-on-month (MoM) and year-on-year (YoY) basis. Core inflation excludes more volatile elements such as food and fuel which can fluctuate because of geopolitical and seasonal factors. Core inflation is the figure economists focus on and is the level targeted by central banks, which are mandated to keep inflation at a manageable level, usually around 2%.
The Consumer Price Index (CPI) measures the change in prices of a basket of goods and services over a period of time. It is usually expressed as a percentage change on a month-on-month (MoM) and year-on-year (YoY) basis. Core CPI is the figure targeted by central banks as it excludes volatile food and fuel inputs. When Core CPI rises above 2% it usually results in higher interest rates and vice versa when it falls below 2%. Since higher interest rates are positive for a currency, higher inflation usually results in a stronger currency. The opposite is true when inflation falls.
Although it may seem counter-intuitive, high inflation in a country pushes up the value of its currency and vice versa for lower inflation. This is because the central bank will normally raise interest rates to combat the higher inflation, which attract more global capital inflows from investors looking for a lucrative place to park their money.
Formerly, Gold was the asset investors turned to in times of high inflation because it preserved its value, and whilst investors will often still buy Gold for its safe-haven properties in times of extreme market turmoil, this is not the case most of the time. This is because when inflation is high, central banks will put up interest rates to combat it. Higher interest rates are negative for Gold because they increase the opportunity-cost of holding Gold vis-a-vis an interest-bearing asset or placing the money in a cash deposit account. On the flipside, lower inflation tends to be positive for Gold as it brings interest rates down, making the bright metal a more viable investment alternative.
Forex News
Keep up with the financial markets, know what's happening and what is affecting the markets with our latest market updates. Analyze market movers, trends and build your trading strategies accordingly.