
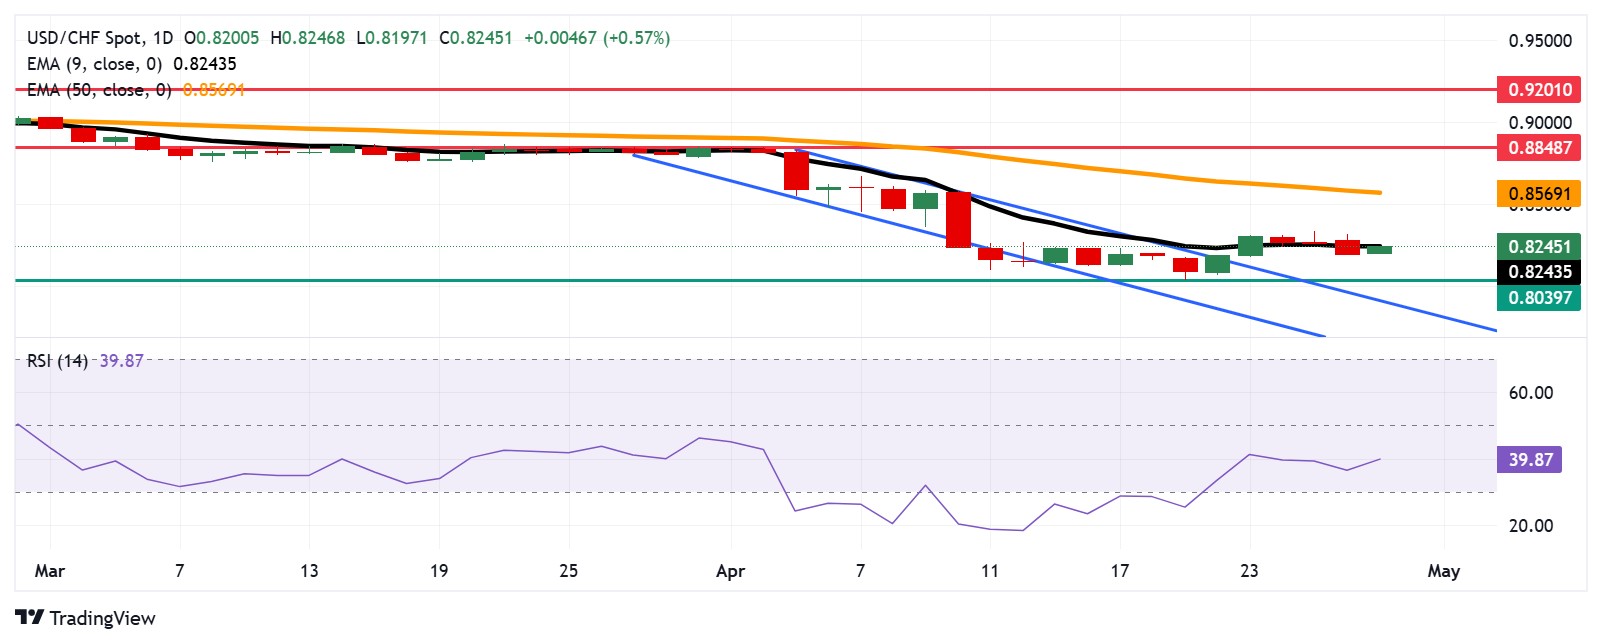
USD/CHF Price Forecast: Tests nine-day EMA barrier near 0.8250
- USD/CHF is testing immediate resistance at the nine-day EMA, positioned at 0.8243.
- The 14-day RSI climbs above the 30 level, indicating a continued short-term corrective rebound.
- A break below 0.8039 — the lowest level since November 2011 — could force the pair back into the descending channel.
The USD/CHF pair halts its three-day losing streak, trading around 0.8240 during the Asian hours on Tuesday. The daily chart analysis indicates a potential bullish shift, as the pair consolidates above the descending channel pattern.
However, USD/CHF continues to trade around the nine-day Exponential Moving Average (EMA), signaling that short-term momentum remains neutral. Meanwhile, the 14-day Relative Strength Index (RSI) has risen above the 30 mark, pointing to a continued short-term corrective rebound. Still, with the RSI remaining below the 50 level, the broader bearish bias persists.
On the upside, USD/CHF is testing immediate resistance at the nine-day EMA, located at 0.8243. A decisive break above this level could strengthen short-term bullish momentum and pave the way for a move toward the 50-day EMA at 0.8569. Further resistance is seen at the monthly high of 0.8848, recorded on April 2.
Primary support is located at 0.8039, the lowest level since November 2011, last recorded on April 21. A break below this level could further weaken price momentum and pressure the pair to re-enter the descending channel, with additional support seen near the upper boundary around the psychological level of 0.7900.
USD/CHF: Daily Chart
Swiss Franc PRICE Today
The table below shows the percentage change of Swiss Franc (CHF) against listed major currencies today. Swiss Franc was the weakest against the US Dollar.
| USD | EUR | GBP | JPY | CAD | AUD | NZD | CHF | |
|---|---|---|---|---|---|---|---|---|
| USD | 0.43% | 0.33% | 0.36% | 0.25% | 0.32% | 0.48% | 0.52% | |
| EUR | -0.43% | -0.07% | -0.06% | -0.15% | -0.08% | 0.06% | 0.11% | |
| GBP | -0.33% | 0.07% | 0.02% | -0.09% | 0.02% | 0.14% | 0.18% | |
| JPY | -0.36% | 0.06% | -0.02% | -0.11% | -0.03% | 0.05% | 0.17% | |
| CAD | -0.25% | 0.15% | 0.09% | 0.11% | 0.07% | 0.23% | 0.26% | |
| AUD | -0.32% | 0.08% | -0.02% | 0.03% | -0.07% | 0.16% | 0.19% | |
| NZD | -0.48% | -0.06% | -0.14% | -0.05% | -0.23% | -0.16% | 0.03% | |
| CHF | -0.52% | -0.11% | -0.18% | -0.17% | -0.26% | -0.19% | -0.03% |
The heat map shows percentage changes of major currencies against each other. The base currency is picked from the left column, while the quote currency is picked from the top row. For example, if you pick the Swiss Franc from the left column and move along the horizontal line to the US Dollar, the percentage change displayed in the box will represent CHF (base)/USD (quote).
Forex News
Keep up with the financial markets, know what's happening and what is affecting the markets with our latest market updates. Analyze market movers, trends and build your trading strategies accordingly.