
NZD/USD Price Forecast: Finds psychological support at 0.5950 near nine-day EMA
- NZD/USD is poised to test the key resistance level at 0.6038, its highest point in six months.
- The 14-day RSI remains above the 50 threshold, indicating a sustained bullish bias.
- The initial support is seen at the psychological level of 0.5950, closely aligned with the nine-day EMA at 0.5945.
The NZD/USD pair remains subdued after registering gains in the previous session, trading around 0.5970 during European hours on Tuesday.
Technical indicators on the daily chart suggest a bullish bias, with the pair remaining above the nine-day Exponential Moving Average (EMA), signaling improved short-term price momentum.
Moreover, the 14-day Relative Strength Index (RSI) is positioned above the 50 mark, suggesting the prevailing bullish bias.
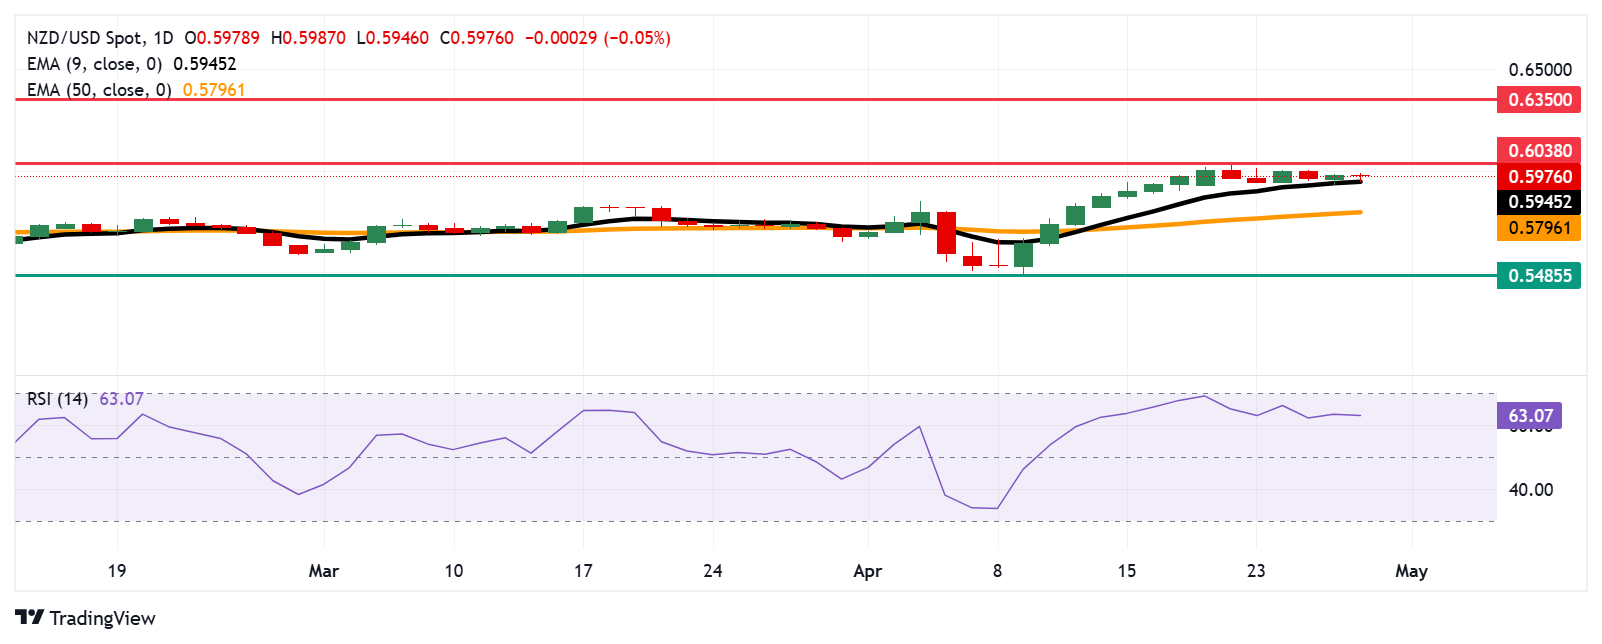
If 14-day RSI rises toward the 70 mark, it could reinforce the market sentiment to test the six-month high of 0.6038, last seen in November 2024. A sustained break above this level could open the doors to explore the area around its seven-month high near 0.6350, recorded in October 2024.
On the downside, the initial support is located at the psychological level of 0.5950, aligned with the nine-day EMA at 0.5945. A break below this crucial support zone could weaken the short-term bullish momentum and open the door for further downside toward the 50-day EMA at 0.5796.
Further depreciation would deepen the bearish bias and put the downward pressure on the NZD/USD pair to test support at 0.5485—a level not visited since March 2020.
NZD/USD: Daily Chart
New Zealand Dollar PRICE Today
The table below shows the percentage change of New Zealand Dollar (NZD) against listed major currencies today. New Zealand Dollar was the weakest against the Canadian Dollar.
| USD | EUR | GBP | JPY | CAD | AUD | NZD | CHF | |
|---|---|---|---|---|---|---|---|---|
| USD | 0.16% | 0.14% | 0.24% | -0.07% | 0.01% | 0.02% | 0.42% | |
| EUR | -0.16% | 0.00% | 0.10% | -0.22% | -0.12% | -0.14% | 0.27% | |
| GBP | -0.14% | -0.01% | 0.08% | -0.22% | -0.11% | -0.13% | 0.27% | |
| JPY | -0.24% | -0.10% | -0.08% | -0.30% | -0.21% | -0.28% | 0.20% | |
| CAD | 0.07% | 0.22% | 0.22% | 0.30% | 0.09% | 0.09% | 0.49% | |
| AUD | -0.01% | 0.12% | 0.11% | 0.21% | -0.09% | -0.01% | 0.39% | |
| NZD | -0.02% | 0.14% | 0.13% | 0.28% | -0.09% | 0.00% | 0.40% | |
| CHF | -0.42% | -0.27% | -0.27% | -0.20% | -0.49% | -0.39% | -0.40% |
The heat map shows percentage changes of major currencies against each other. The base currency is picked from the left column, while the quote currency is picked from the top row. For example, if you pick the New Zealand Dollar from the left column and move along the horizontal line to the US Dollar, the percentage change displayed in the box will represent NZD (base)/USD (quote).
Forex News
Keep up with the financial markets, know what's happening and what is affecting the markets with our latest market updates. Analyze market movers, trends and build your trading strategies accordingly.