Candlestick Patterns for Beginners: How to Read Forex Charts?
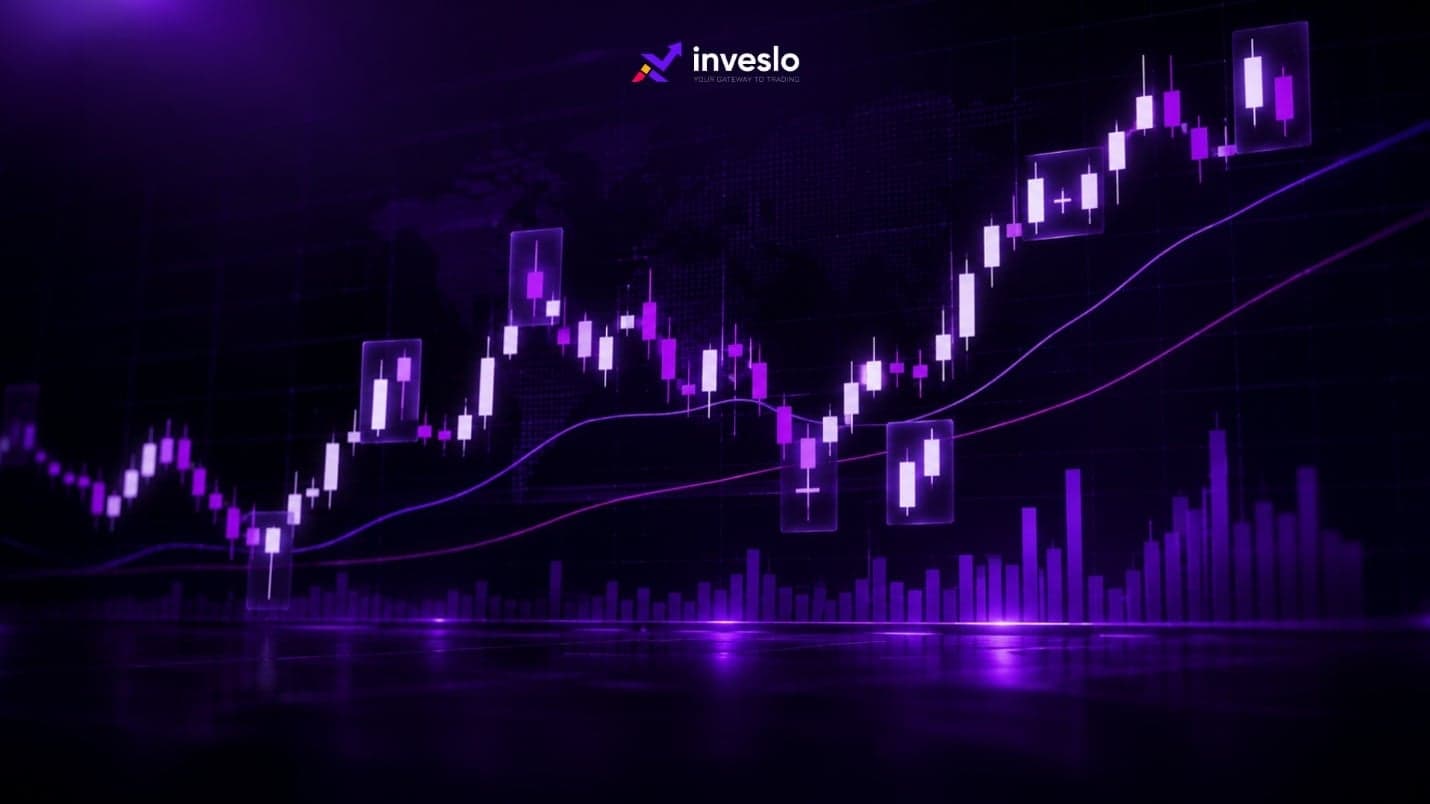
Most beginners studying candlestick patterns can name a hammer or a doji within a week. Reading them in a live chart, under pressure, with real money on the line, is a different skill entirely. This article covers how candlestick charts actually work, which patterns are worth your attention, and how to apply them without falling into the traps that catch most new traders. No jargon left unexplained.
Table of Contents
- What are Candlestick Patterns?
- How to Read a Single Candlestick
- Essential Bullish and Bearish Candlestick Patterns
- How to Combine Candlestick Patterns with Other Trading Tools
- Common Mistakes Beginners Make with Candlestick Patterns
- Key Takeaways
- FAQ
What are Candlestick Patterns?
Candlestick patterns are visual representations of price movement that show the open, close, high, and low of an asset within a set time period. Munehisa Homma, a Japanese rice trader in the 18th century, developed them to track how market sentiment shifted over time. Today candlestick charts are the default chart type on virtually every forex and CFD platform in the world.
The body of the candle shows the distance between where price opened and where it closed. A green (or white) body means the close was higher than the open, reflecting buying pressure over that session. A red (or black) body means the close was lower, reflecting selling pressure.
The thin lines extending above and below the body are called wicks, sometimes referred to as shadows, and they show the full price range traded during that period, including the extremes that didn't hold by the close.
That last detail matters more than most beginners realise.
How to Read a Single Candlestick
Reading a single candlestick accurately is the foundation of pattern recognition. Before you can spot patterns, you need to decode individual candles with some precision:
- Identify the body size. A large body means strong conviction from buyers or sellers. A small body suggests indecision in the market.
- Check the wicks. Long upper wicks mean buyers pushed prices up but sellers pushed back. Long lower wicks mean sellers drove prices down but buyers recovered ground.
- Note the position. Where does this candle appear in the chart? A long red candle at the top of a rally carries a very different meaning from the same candle at the bottom of a downtrend.
- Consider the timeframe. A pattern on a daily chart carries more weight than the same pattern on a five-minute chart, because it represents more consolidated price action.
Practical tip: Always zoom out before you zoom in. Checking the broader trend on a weekly or daily chart before analysing individual candles on a one-hour chart will save you from misreading context entirely.
Single candles tell you what happened in one session. But context, meaning where that session sits within the broader price story, is what tells you whether it matters. That's where patterns come in.
Essential Bullish and Bearish Candlestick Patterns
Most candlestick pattern libraries contain dozens of named formations. In practice, a handful of them account for the majority of useful signals in forex trading. Below is a reference table covering the patterns most relevant to beginners.
|
Pattern |
Type |
What It Signals |
Reliability |
|
Doji |
Neutral |
Indecision; possible reversal |
Moderate |
|
Hammer |
Bullish reversal |
Buyers rejecting lower prices |
Moderate-High |
|
Shooting Star |
Bearish reversal |
Sellers rejecting higher prices |
Moderate-High |
|
Bullish Engulfing |
Bullish reversal |
Strong buying overwhelms selling |
High |
|
Bearish Engulfing |
Bearish reversal |
Strong selling overwhelms buying |
High |
|
Morning Star |
Bullish reversal |
Three-candle bottom formation |
High |
|
Evening Star |
Bearish reversal |
Three-candle top formation |
High |
The Hammer deserves a closer look. It forms when a candle has a small body near the top of its range and a long lower wick, at least twice the body's length. The market tried to sell off, failed, and buyers snapped prices back up before the session closed. When this appears after a sustained downtrend, it often marks the point where sellers have run out of steam. Not always, but often enough to pay attention.
Engulfing patterns are two-candle formations. A bullish engulfing pattern occurs when a green candle's body completely covers the previous red candle's body, signalling a decisive shift in momentum. The larger the second candle relative to the first, the stronger the signal tends to be. Visually, it's fairly hard to miss once you know what you're looking for.
A Doji doesn't signal direction on its own. It signals that neither buyers nor sellers won that session. After a strong trend in either direction, a doji appearing at a key price level can be an early warning that the move is losing conviction, even if it doesn't tell you exactly what comes next.
How to Combine Candlestick Patterns with Other Trading Tools
Candlestick patterns don't work in isolation. A hammer at a random point on a chart is mildly interesting. A hammer sitting right on a well-established support level, with the Relative Strength Index starting to turn upward, is something worth acting on.
The most reliable approach combines three elements:
- A candlestick pattern that appears at a meaningful point on the chart
- A key price level such as support, resistance, or a major moving average
- A confirming indicator such as RSI, volume, or a moving average crossover
Forex markets add another layer worth understanding. Major pairs like EUR/USD and GBP/USD carry enough liquidity that candlestick signals on higher timeframes, particularly daily and four-hour charts, tend to be considerably more reliable than signals in thinner, less-traded markets where a single large order can distort what the candle appears to show.
Platforms like Inveslo provide integrated charting tools alongside educational resources, which helps beginners build pattern recognition without constantly switching between tools. Clean charts and reasonably fast execution matter more than most new traders initially appreciate.
Common Mistakes Beginners Make with Candlestick Patterns
Knowing patterns is only half the challenge. Applying them without falling into predictable traps is where most beginners lose ground.
- Trading patterns against the trend: A hammer in the middle of a strong downtrend is far less reliable than one at a clear support level after a prolonged decline. Always trade with the broader trend unless you have strong reasons not to.
- Ignoring the timeframe: Candlestick patterns on a one-minute chart are noise for most beginners. Daily and four-hour charts filter out most of the random price fluctuation and give signals more time to develop.
- Skipping confirmation: Never enter a trade based purely on a pattern forming. Wait for the candle to close fully, then look for one confirming signal from another tool before committing.
- Over-relying on one pattern: No single candlestick formation is right 100% of the time. Treat patterns as probability tools, not guarantees.
A stop-loss order is essential whenever you trade based on a candlestick signal. Define your risk level before you enter. Not after, not while the position is already moving, but before you click the button.
Key Takeaways
Candlestick patterns for beginners don't need to be overwhelming. The core skill is learning to read price action honestly: what buyers and sellers actually did during a session, not what you hope they'll do next.
- Body and wick: The body shows open-to-close range; the wick shows the full session range and rejection pressure.
- Context is everything: The same pattern means different things depending on trend direction and key price levels.
- Confirmation first: Combine any candlestick signal with at least one supporting tool before entering a trade.
- Risk management: Always define your stop-loss level before opening a position based on a pattern.
Spend time on a demo account identifying these formations in real chart history before trading live capital.
FAQ
Which candlestick pattern is best for beginners?
The bullish and bearish engulfing patterns are a solid starting point. They're visually clear, require only two candles, and signal a decisive shift in momentum. Combined with a nearby support or resistance level, they offer one of the more readable setups for beginners to practise.
How accurate are candlestick patterns in forex trading?
Accuracy depends heavily on context. No pattern is reliable in isolation. When combined with trend direction, key price levels, and a confirming indicator, success rates improve meaningfully. Adding a confirming tool such as volume or RSI tends to reduce false signals and improve overall pattern reliability.
Should beginners use candlestick patterns on short timeframes?
Generally not. One-minute and five-minute charts produce too much noise for pattern recognition to be consistent. Daily and four-hour charts are far more suitable for beginners developing their chart reading skills.
Do candlestick patterns work the same across all currency pairs?
The patterns themselves are universal, but reliability varies by liquidity. Major pairs like EUR/USD and USD/JPY, which see the highest daily volume, tend to produce cleaner, more reliable signals than exotic pairs with thinner markets.
Related articles
 ForexInveslo
What is the Consumer Price Index (CPI)?
The Consumer Price Index (CPI) tracks the average change over time in prices consumers pay for a representative basket of goods and services. It is one of the main measures used to monitor consumer inflation.
 ForexInveslo
What is a Trading Journal & How Do Traders Use It?
A trader can remember a big winner for months and forget three poorly planned trades from the same week. That is one reason relying on memory makes trade review difficult.
 ForexInveslo
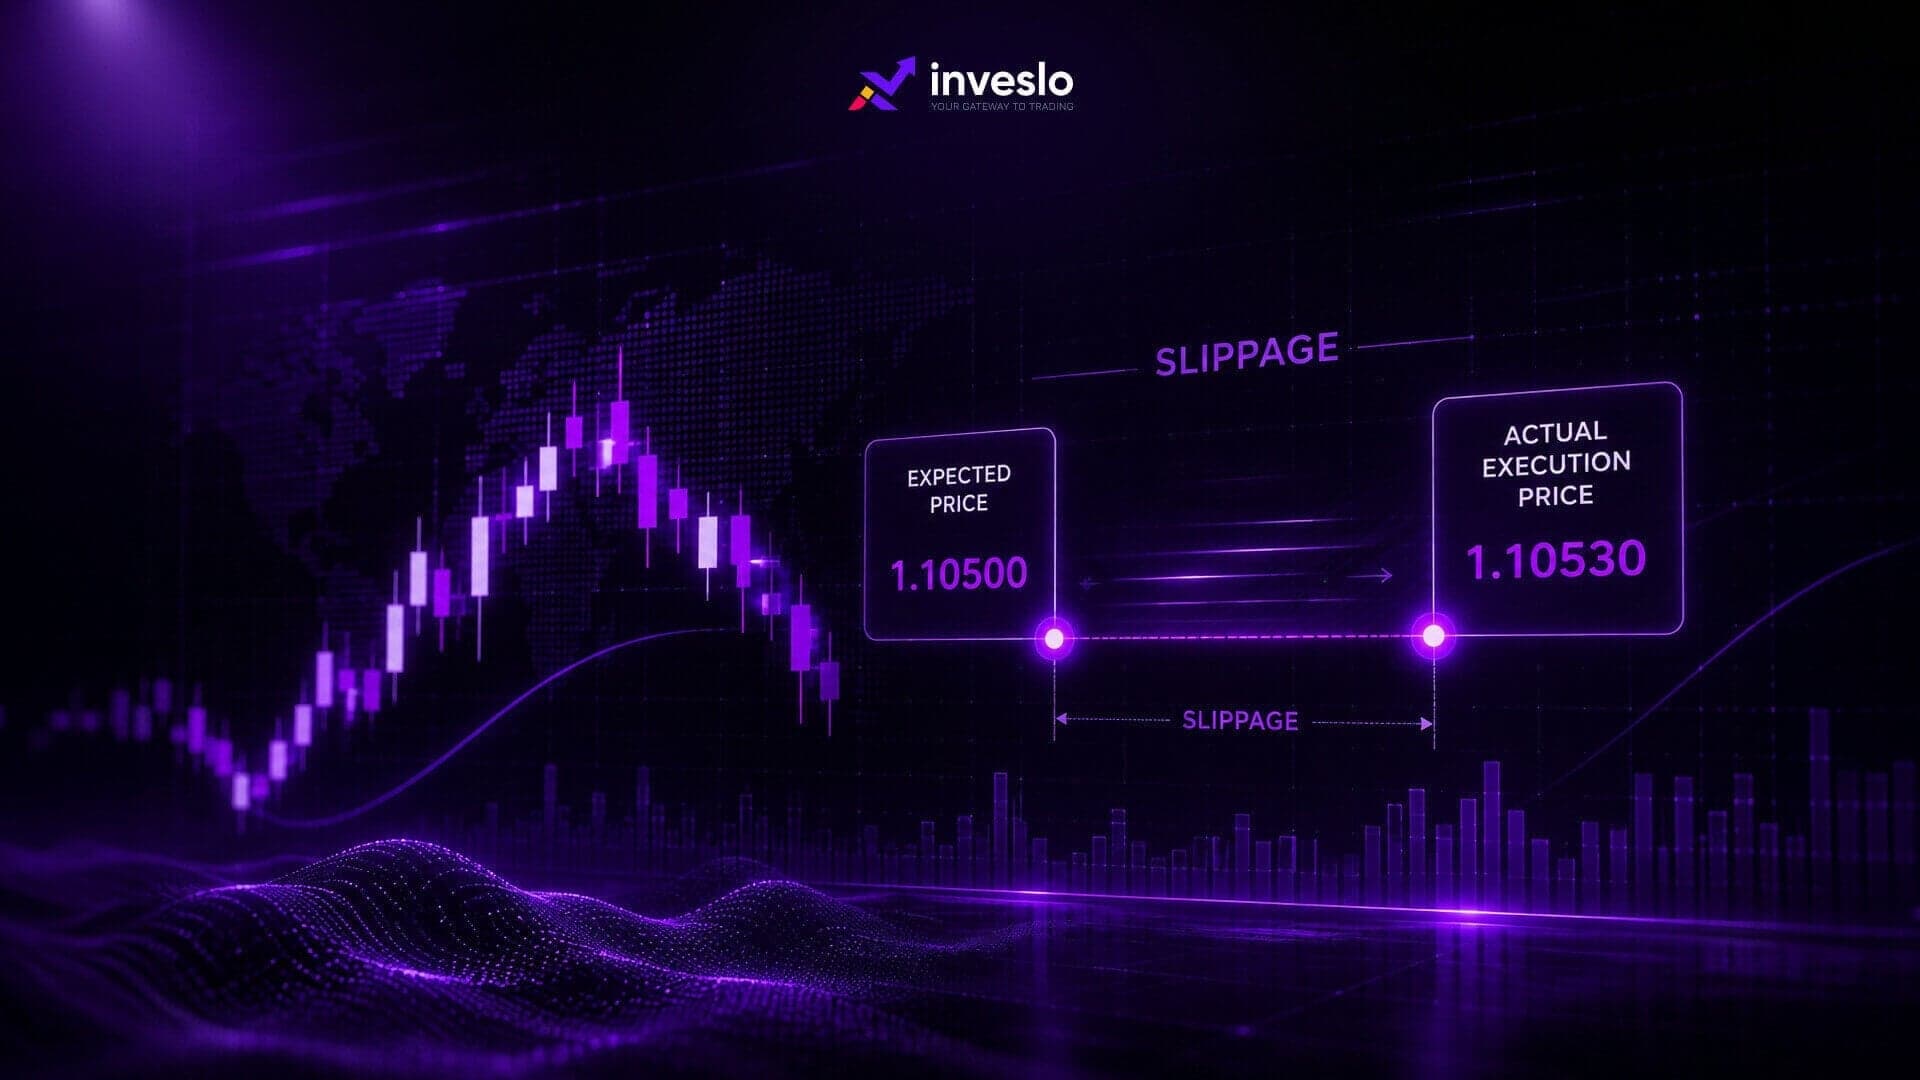
Slippage in Trading: What it is and How to Reduce it?
Slippage in trading costs most retail traders more than they realise, and it's rarely discussed until after the damage is done. You place an order at one price, it fills at another, and suddenly your trade is already underwater before the market's moved a tick against you. It happens fast.