Australian Dollar holds losses as US Dollar remains subdued ahead of ISM Manufacturing PMI
- The Australian Dollar loses ground ahead of the US ISM Manufacturing PMI data release on Thursday.
- Australia’s Bureau of Statistics reported a trade surplus of AUD 6.9 billion for March, surpassing expectations of AUD 3.13 billion.
- President Trump expressed optimism about a potential trade agreement with China.
The Australian Dollar (AUD) is facing headwinds against the US Dollar (USD) as traders adopt caution ahead of the Institute for Supply Management’s (ISM) Manufacturing Purchasing Managers Index (PMI) data from the United States (US) release due later on Thursday. However, the AUD/USD pair received support after the release of Trade Balance data from Australia.
The Australian Bureau of Statistics reported a trade surplus of AUD 6.9 billion for March, significantly surpassing expectations of AUD 3.13 billion and the revised February figure of AUD 2.85 billion (down from AUD 2.97 billion). The strong surplus was driven by a 7.6% rise in exports and a 2.2% decline in imports for the month.
On Wednesday, the Australian Bureau of Statistics (ABS) reported that the Consumer Price Index (CPI) rose by 0.9% quarter-over-quarter in Q1 2025, up from a 0.2% increase in Q4 2024 and exceeding market expectations of a 0.8% rise. On an annual basis, CPI climbed 2.4% in the first quarter, beating the forecast of 2.2%.
Meanwhile, inflationary pressures in Australia in early 2025 have weakened expectations of further monetary easing by the Reserve Bank of Australia (RBA). Markets widely anticipate a 25-basis-point rate cut in May, as policymakers prepare for possible economic fallout from the recently introduced US tariffs.
The US Dollar gains support as US President Donald Trump, during a NewsNation Town Hall interview early Thursday, expressed optimism about a potential trade agreement with China, stating there is a "very good probability we'll reach a deal." Trump emphasized that any agreement with China must meet US conditions. He also mentioned the possibility of future trade deals with India, South Korea, and Japan, and noted that a deal with Ukraine was finalized earlier in the day.
Australian Dollar falls as US Dollar advances on improved US-China talks
- The US Dollar Index (DXY), which measures the USD against six major currencies, is gaining ground for the third successive day and trading around the 99.70 level at the time of writing. The US Dollar strengthens as traders scale back expectations for a 1% interest rate cut by the US Federal Reserve (Fed) this year, following data indicating a contraction in the US economy last quarter.
- US Gross Domestic Product (GDP) contracted by 0.3% annualized in the first quarter of 2025, missing the forecast for 0.4% growth and sharply down from the 2.4% expansion in the previous quarter. Meanwhile, the core Personal Consumption Expenditure (PCE) Price Index—a key inflation gauge—rose 2.6% year-on-year in March, in line with expectations but slower than February’s 2.8% increase.
- On Tuesday, the US Bureau of Labor Statistics reported that Job Openings and Labor Turnover Survey (JOLTS) openings dropped to 7.19 million in March, down from a revised 7.48 million in February and below the market forecast of 7.5 million. This marks the lowest level since September 2024, reflecting softening labor demand amid growing economic uncertainty in the United States (US).
- US President Donald Trump signaled openness to reducing Chinese tariffs, while Beijing exempted certain US goods from its 125% levies. This move has fueled hopes that the prolonged trade war between the world's two largest economies might be drawing to a close.
- Australia’s Monthly CPI held steady with a 2.4% year-over-year increase in March. Meanwhile, the Reserve Bank of Australia’s (RBA) Trimmed Mean CPI rose 2.9% year-over-year in Q1, in line with expectations, while the quarterly figure also met forecasts at 0.7%.
- Australian Treasurer Jim Chalmers noted that markets still anticipate further interest rate cuts. “The market expects more interest rate cuts after inflation figures,” he stated, adding that there’s “nothing in these numbers that would substantially alter market expectations.”
- In China, the National Bureau of Statistics (NBS) reported that the Manufacturing Purchasing Managers' Index (PMI) slipped to 49.0 in April from 50.5 in March, falling short of the 49.9 consensus and indicating a return to contraction. The Non-Manufacturing PMI also softened, easing to 50.4 in April from 50.8 in March, below the expected 50.7.
- Chinese Foreign Minister Wang Yi said on Tuesday that making concessions and retreating would only embolden the bully, emphasizing that dialogue is key to resolving differences.
Australian Dollar hovers around 0.6400; finds support near nine-day EMA
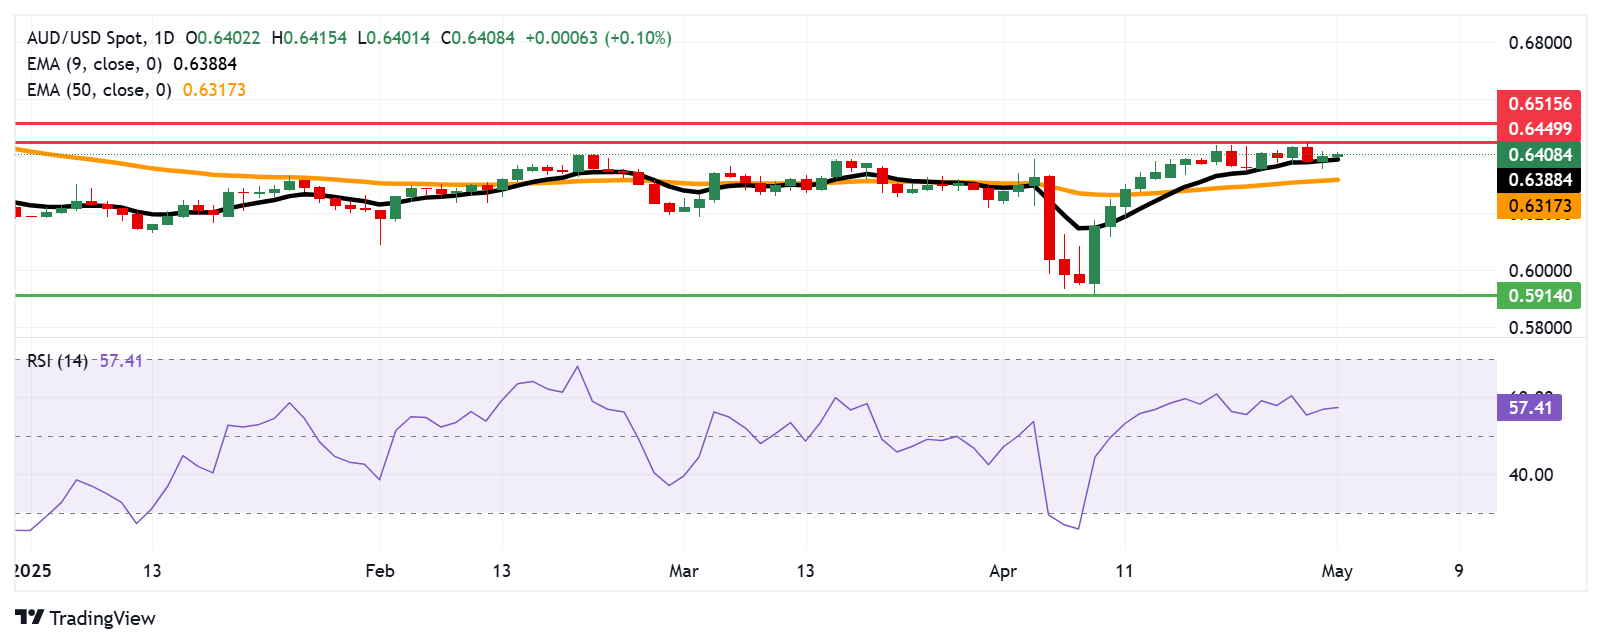
The AUD/USD pair is trading near 0.6410 on Thursday, with the daily chart maintaining a bullish tone. The pair remains above the nine-day Exponential Moving Average (EMA), and the 14-day Relative Strength Index (RSI) stays comfortably above the 50 mark—both indicating continued upward momentum.
On the upside, immediate resistance lies at the recent four-month high of 0.6449, hit on April 29. A clear break above this level could open the door toward the five-month high of 0.6515.
To the downside, initial support is seen at the nine-day EMA at 0.6388, followed by the 50-day EMA at 0.6317. A break below these levels would undermine the bullish bias and could expose the pair to further downside, potentially targeting the March 2020 low near 0.5914.
AUD/USD: Daily Chart
Australian Dollar PRICE Today
The table below shows the percentage change of Australian Dollar (AUD) against listed major currencies today. Australian Dollar was the weakest against the New Zealand Dollar.
| USD | EUR | GBP | JPY | CAD | AUD | NZD | CHF | |
|---|---|---|---|---|---|---|---|---|
| USD | 0.21% | 0.24% | 0.78% | 0.00% | 0.03% | -0.02% | 0.21% | |
| EUR | -0.21% | 0.03% | 0.62% | -0.24% | -0.18% | -0.22% | -0.01% | |
| GBP | -0.24% | -0.03% | 0.54% | -0.24% | -0.21% | -0.28% | -0.05% | |
| JPY | -0.78% | -0.62% | -0.54% | -0.82% | -0.77% | -0.87% | -0.67% | |
| CAD | -0.00% | 0.24% | 0.24% | 0.82% | 0.04% | -0.03% | 0.20% | |
| AUD | -0.03% | 0.18% | 0.21% | 0.77% | -0.04% | -0.05% | 0.17% | |
| NZD | 0.02% | 0.22% | 0.28% | 0.87% | 0.03% | 0.05% | 0.22% | |
| CHF | -0.21% | 0.01% | 0.05% | 0.67% | -0.20% | -0.17% | -0.22% |
The heat map shows percentage changes of major currencies against each other. The base currency is picked from the left column, while the quote currency is picked from the top row. For example, if you pick the Australian Dollar from the left column and move along the horizontal line to the US Dollar, the percentage change displayed in the box will represent AUD (base)/USD (quote).
Economic Indicator
ISM Manufacturing PMI
The Institute for Supply Management (ISM) Manufacturing Purchasing Managers Index (PMI), released on a monthly basis, is a leading indicator gauging business activity in the US manufacturing sector. The indicator is obtained from a survey of manufacturing supply executives based on information they have collected within their respective organizations. Survey responses reflect the change, if any, in the current month compared to the previous month. A reading above 50 indicates that the manufacturing economy is generally expanding, a bullish sign for the US Dollar (USD). A reading below 50 signals that factory activity is generally declining, which is seen as bearish for USD.
Read more.Next release: Thu May 01, 2025 14:00
Frequency: Monthly
Consensus: 48
Previous: 49
Source: Institute for Supply Management
The Institute for Supply Management’s (ISM) Manufacturing Purchasing Managers Index (PMI) provides a reliable outlook on the state of the US manufacturing sector. A reading above 50 suggests that the business activity expanded during the survey period and vice versa. PMIs are considered to be leading indicators and could signal a shift in the economic cycle. Stronger-than-expected prints usually have a positive impact on the USD. In addition to the headline PMI, the Employment Index and the Prices Paid Index numbers are watched closely as they shine a light on the labour market and inflation.
Forex News
Keep up with the financial markets, know what's happening and what is affecting the markets with our latest market updates. Analyze market movers, trends and build your trading strategies accordingly.