Australian Dollar remains stronger as CPI rises in Q1, US Core PCE Price Index awaited
- The Australian Dollar is regaining ground after the release of key economic data from both Australia and China.
- Australia’s Consumer Price Index rose 0.9% QoQ in Q1, up from a 0.2% previous increase and a 0.8% expected rise.
- China’s NBS Manufacturing PMI dropped to 49.0 in April from 50.5 in March, returning to contraction in the sector.
The Australian Dollar (AUD) is gaining ground on Wednesday following a more than 0.50% decline against the US Dollar (USD) in the previous session. The AUD/USD pair appreciates following the release of key economic data from Australia and China.
The Australian Bureau of Statistics (ABS) reported that the Consumer Price Index (CPI) rose by 0.9% quarter-over-quarter in Q1 2025, up from a 0.2% increase in Q4 2024 and exceeding market expectations of a 0.8% rise. On an annual basis, CPI climbed 2.4% in the first quarter, beating the forecast of 2.2%.
Australia’s Monthly CPI held steady with a 2.4% year-over-year increase in March. Meanwhile, the Reserve Bank of Australia’s (RBA) Trimmed Mean CPI rose 2.9% year-over-year in Q1, in line with expectations, while the quarterly figure also met forecasts at 0.7%.
In China, the National Bureau of Statistics (NBS) reported that the Manufacturing Purchasing Managers' Index (PMI) slipped to 49.0 in April from 50.5 in March, falling short of the 49.9 consensus and indicating a return to contraction. The Non-Manufacturing PMI also softened, easing to 50.4 in April from 50.8 in March, below the expected 50.7.
The AUD faces headwinds amid ongoing global trade uncertainties that continue to dampen investor sentiment. Meanwhile, inflationary pressures in Australia in early 2025 have weakened expectations of further monetary easing by the Reserve Bank of Australia (RBA). Markets widely anticipate a 25-basis-point rate cut in May, as policymakers prepare for possible economic fallout from the recently introduced US tariffs.
Australian Dollar recovers ground as confidence in American assets weakens
- The US Dollar Index (DXY), which measures the USD against six major currencies, is maintaining its position above the 99.00 level at the time of writing. Attention now turns to the US Core Personal Consumption Expenditures (PCE) Price Index report for March, due later on Wednesday.
- On Tuesday, the US Bureau of Labor Statistics reported that Job Openings and Labor Turnover Survey (JOLTS) openings dropped to 7.19 million in March, down from a revised 7.48 million in February and below the market forecast of 7.5 million. This marks the lowest level since September 2024, reflecting softening labor demand amid growing economic uncertainty in the United States (US).
- US President Donald Trump signaled openness to reducing Chinese tariffs, while Beijing exempted certain US goods from its 125% levies. This move has fueled hopes that the prolonged trade war between the world's two largest economies might be drawing to a close.
- President Trump said that there has been progress, and he has talked with China’s President Xi Jinping. However, a Chinese embassy spokesperson on Friday firmly denied any current negotiations with the US, stating, "China and the US are not having any consultation or negotiation on tariffs." The spokesperson urged Washington to "stop creating confusion."
- According to the Wall Street Journal, President Trump intends to lessen the impact of his automotive tariffs by ensuring that duties on foreign-made cars do not stack with other tariffs and by reducing levies on foreign parts used in car production.
- US Treasury Secretary Scott Bessent said on Monday that he interacted with Chinese authorities last week but did not mention tariffs. Bessent stated that while the US government is in communication with China, it is up to Beijing to make the first move to ease the tariff dispute, given the trade imbalance between the two countries.
- Chinese Foreign Minister Wang Yi said on Tuesday that making concessions and retreating would only embolden the bully, emphasizing that dialogue is key to resolving differences.
- China's Finance Ministry stated on Friday that global economic growth remains sluggish, with tariffs and trade wars continuing to undermine economic and financial stability. The ministry urged all parties to enhance the international economic and financial system through stronger multilateral cooperation, per Reuters.
Australian Dollar rises above 0.6400 after pulling back from nine-day EMA
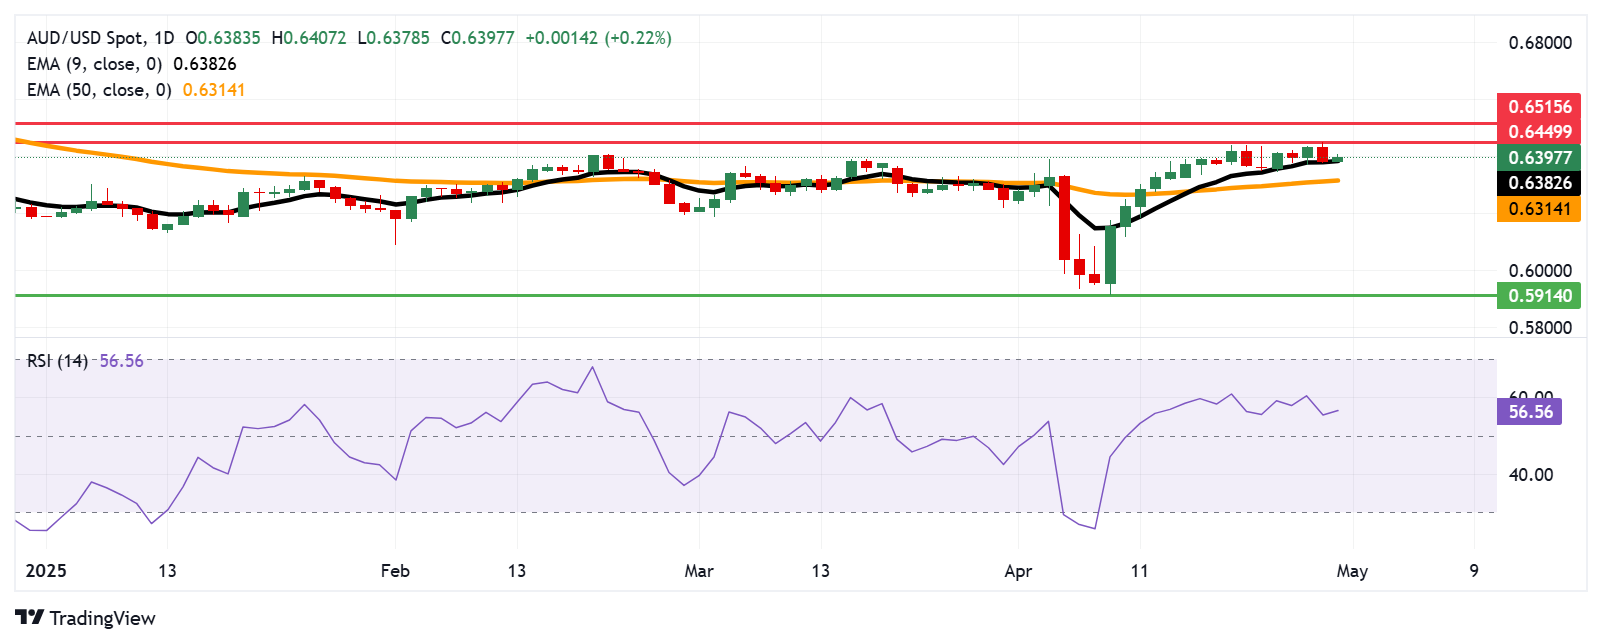
The AUD/USD pair is hovering around 0.6410 on Wednesday, with the daily chart reflecting a bullish outlook. The pair continues to trade above the nine-day Exponential Moving Average (EMA), while the 14-day Relative Strength Index (RSI) holds well above the 50 level—both suggesting sustained upward momentum.
On the upside, immediate resistance is seen at the recent four-month high of 0.6449, which was reached on April 29. A decisive break above this level could pave the way for a move toward the five-month high at 0.6515.
The nine-day EMA at 0.6382 appears as the immediate support, followed by the 50-day EMA at 0.6314. A break below these support levels would weaken the bullish structure and may expose the pair to deeper losses, potentially targeting the March 2020 low around 0.5914.
AUD/USD: Daily Chart
Australian Dollar PRICE Today
The table below shows the percentage change of Australian Dollar (AUD) against listed major currencies today. Australian Dollar was the strongest against the Japanese Yen.
| USD | EUR | GBP | JPY | CAD | AUD | NZD | CHF | |
|---|---|---|---|---|---|---|---|---|
| USD | 0.05% | 0.08% | 0.10% | -0.04% | -0.49% | -0.12% | -0.09% | |
| EUR | -0.05% | 0.05% | 0.05% | -0.08% | -0.55% | -0.17% | -0.13% | |
| GBP | -0.08% | -0.05% | 0.00% | -0.13% | -0.58% | -0.22% | -0.18% | |
| JPY | -0.10% | -0.05% | 0.00% | -0.14% | -0.58% | -0.16% | -0.17% | |
| CAD | 0.04% | 0.08% | 0.13% | 0.14% | -0.45% | -0.09% | -0.04% | |
| AUD | 0.49% | 0.55% | 0.58% | 0.58% | 0.45% | 0.37% | 0.42% | |
| NZD | 0.12% | 0.17% | 0.22% | 0.16% | 0.09% | -0.37% | 0.04% | |
| CHF | 0.09% | 0.13% | 0.18% | 0.17% | 0.04% | -0.42% | -0.04% |
The heat map shows percentage changes of major currencies against each other. The base currency is picked from the left column, while the quote currency is picked from the top row. For example, if you pick the Australian Dollar from the left column and move along the horizontal line to the US Dollar, the percentage change displayed in the box will represent AUD (base)/USD (quote).
Economic Indicator
Core Personal Consumption Expenditures - Price Index (YoY)
The Core Personal Consumption Expenditures (PCE), released by the US Bureau of Economic Analysis on a monthly basis, measures the changes in the prices of goods and services purchased by consumers in the United States (US). The PCE Price Index is also the Federal Reserve’s (Fed) preferred gauge of inflation. The YoY reading compares the prices of goods in the reference month to the same month a year earlier. The core reading excludes the so-called more volatile food and energy components to give a more accurate measurement of price pressures." Generally, a high reading is bullish for the US Dollar (USD), while a low reading is bearish.
Read more.Next release: Wed Apr 30, 2025 12:30
Frequency: Monthly
Consensus: 2.6%
Previous: 2.8%
Source: US Bureau of Economic Analysis
After publishing the GDP report, the US Bureau of Economic Analysis releases the Personal Consumption Expenditures (PCE) Price Index data alongside the monthly changes in Personal Spending and Personal Income. FOMC policymakers use the annual Core PCE Price Index, which excludes volatile food and energy prices, as their primary gauge of inflation. A stronger-than-expected reading could help the USD outperform its rivals as it would hint at a possible hawkish shift in the Fed’s forward guidance and vice versa.
Forex News
Keep up with the financial markets, know what's happening and what is affecting the markets with our latest market updates. Analyze market movers, trends and build your trading strategies accordingly.