Gold price keeps the red above $3,300; looks to key US macro data for fresh impetus
- Gold price attracts some sellers for the second straight day amid receding safe-haven demand.
- A stronger USD further exerts pressure on the commodity amid signs of easing trade tensions.
- Fed rate cut bets might cap the USD and help limit losses for the non-yielding yellow metal.
Gold price (XAU/USD) sticks negative bias for the second successive day, though it manages to hold above the $3,300 round figure heading into the European session on Wednesday. The global equity markets continue to rise amid signs of easing US-China trade tensions and US President Donald Trump's decision to give flexibility on tariffs to US carmakers. This, along with a modest US Dollar (USD) uptick, turn out to be key factors undermining demand for the safe-haven precious metal.
Meanwhile, Trump's rapidly shifting stance on trade policies has been received poorly by investors and led to a mass pivot away from US assets recently. Adding to this, prospects for more aggressive policy easing by the Federal Reserve (Fed), amid heightened concerns over the economic impact of tariffs, might continue to act as a headwind for the USD. This, in turn, lends some support to the non-yielding Gold price and limits the downside, warranting some caution for bearish traders.
Daily Digest Market Movers: Gold price bears seem non-committed despite positive risk tone, modest USD uptic
- President Donald Trump signed an order on Tuesday to ease tariff effects on the auto industry, giving carmakers two years to increase the share of domestic parts in US-assembled vehicles. This adds to the optimism over progress on trade negotiations and signs of the potential de-escalation of US-China trade tensions.
- The US Dollar attracts some buyers for the second straight day and also acts as a headwind for the Gold price. Investors, however, remain on the edge as Trump's erratic trade policies continue to fuel worries about a sharp economic slowdown. Moreover, bets that the Federal Reserve will resume its rate-cutting cycle soon should cap any meaningful USD upside.
- Dovish Fed expectations were reaffirmed by the disappointing US Job Openings and Labor Turnover Survey (JOLTS) and the US Conference Board’s Consumer Confidence Index released on Tuesday. In fact, the US Bureau of Labor Statistics (BLS) reported that US job openings fell to 7.19 million by the last day of March from 7.480 million in the previous month.
- Adding to this, the US Consumer Confidence Index slumped to 86.0 in April, or a nearly five-year low. Furthermore, the Present Situation Index and the Expectations Index dropped to 133.5 and 54.4, respectively, during the reported month. The data strengthens the case for more aggressive policy easing by the Fed and should support the non-yielding yellow metal.
- On the geopolitical front, Russia dismissed Ukraine’s proposal to extend Russian President Vladimir Putin’s unilateral three-day ceasefire to 30 days. Moreover, the US threatened to stop its efforts to end the conflict between Russia and Ukraine if both parties didn't deliver concrete proposals. This further contributes to limiting the downside for the XAU/USD pair.
- Traders now look to Wednesday's US economic docket – featuring the ADP report on private-sector employment, the Advance Q1 GDP print, and the Personal Consumption and Expenditure (PCE) Price Index. This, along with the US Nonfarm Payrolls report on Friday, should provide cues about the Fed's policy outlook and influence the commodity in the near term.
Gold price bulls not ready to give up yet, the $3,300 pivotal support holds the key
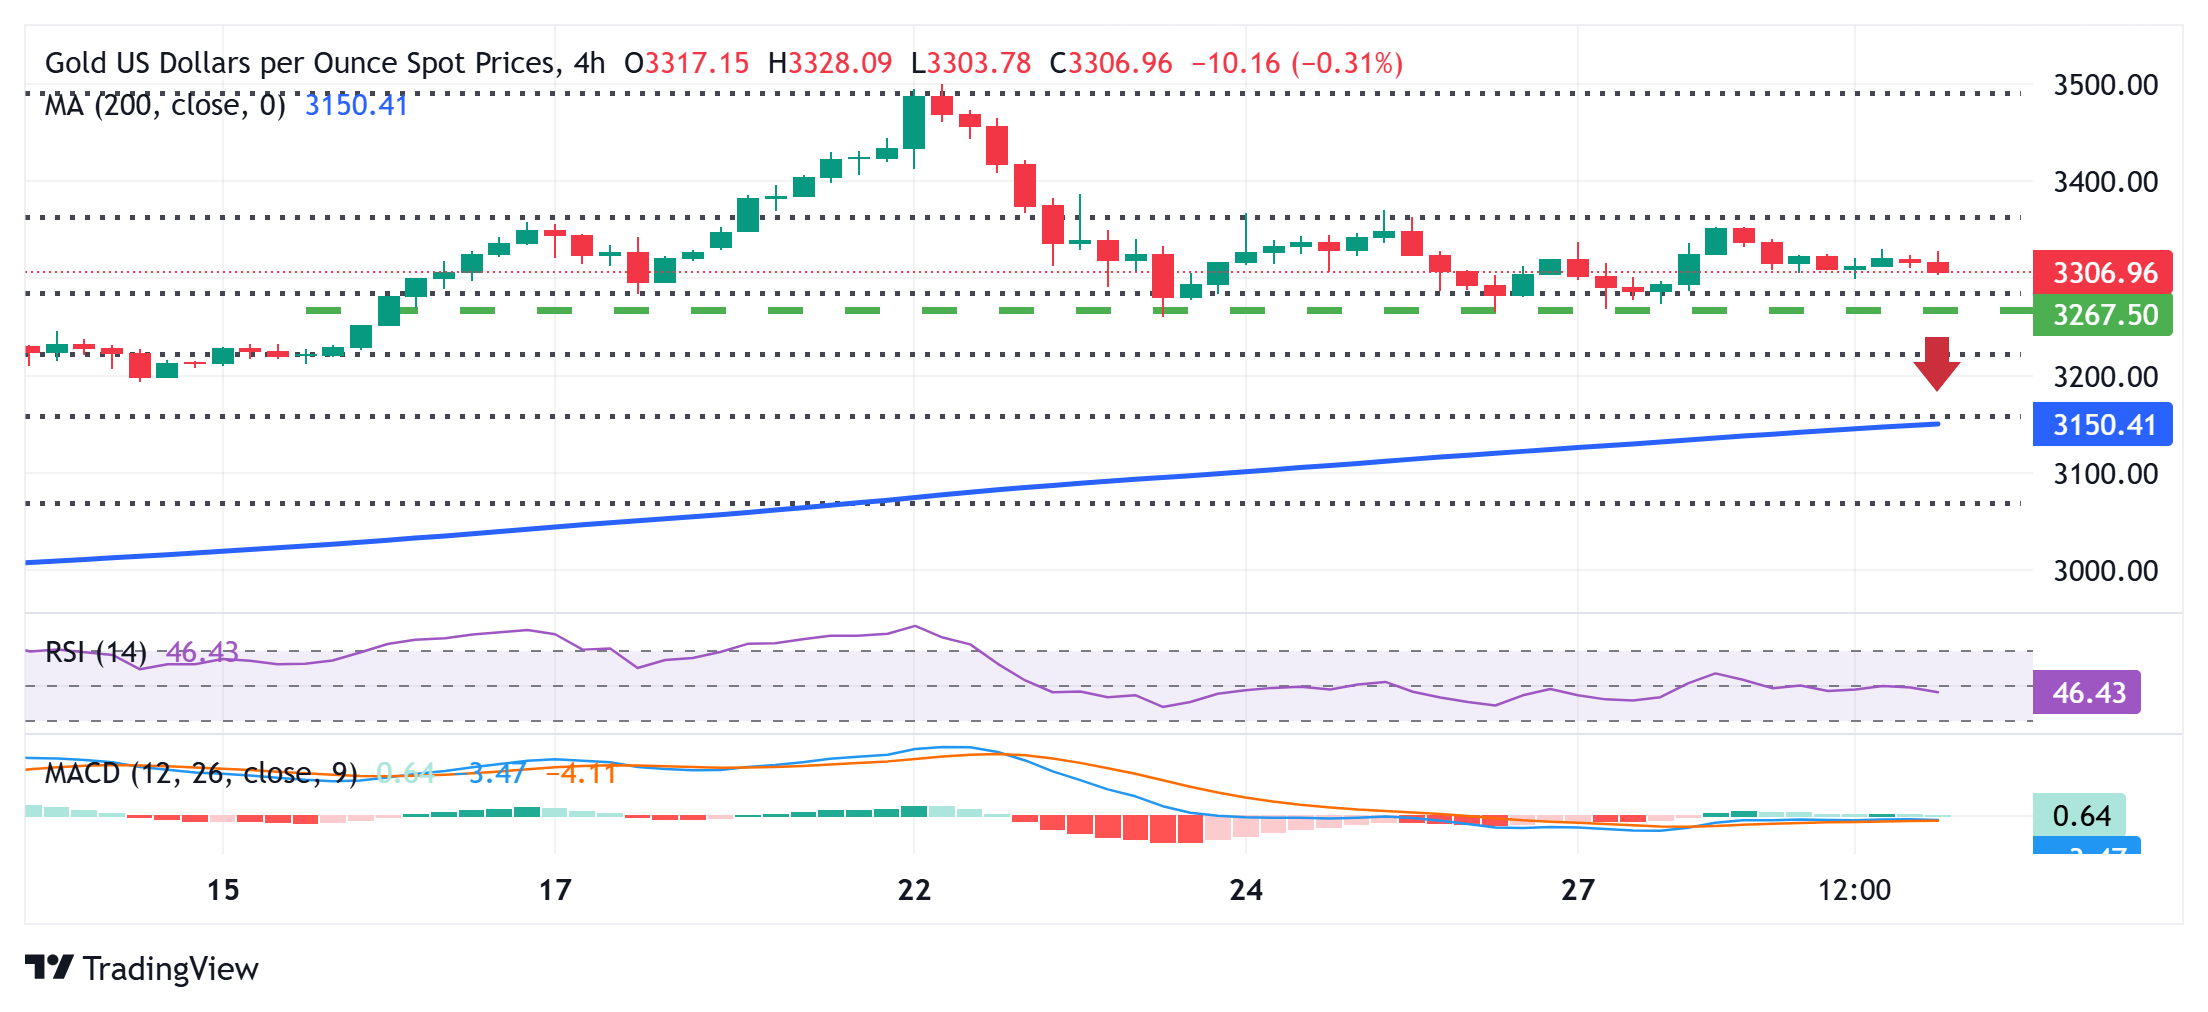
Technical indicators on the daily chart hold comfortably in the positive territory and favor the XAU/USD bulls. Hence, any further weakness below the $3,300-3,290 immediate support, representing the 38.2% Fibonacci retracement level of the latest leg up from the vicinity of mid-$2,900s or the monthly swing low, might continue to find decent support near the $3,265-3,260 zone. A convincing break below the latter, however, would set the stage for an extension of the recent pullback from the all-time peak touched last week. The downward trajectory might then drag the Gold price to the 50% retracement level, around the $3,225 region, en route to the $3,200 mark.
On the flip side, the Asian session high, around the $3,328 region, could act as an immediate hurdle ahead of the $3,348-3,353 area. This is closely followed by the $3,366-3,368 supply zone, which if cleared should allow the Gold price to reclaim the $3,400 mark. The momentum could extend further toward the $3,425-3,427 intermediate hurdle before bulls make a fresh attempt to conquer the $3,500 psychological mark.
Economic Indicator
Core Personal Consumption Expenditures - Price Index (YoY)
The Core Personal Consumption Expenditures (PCE), released by the US Bureau of Economic Analysis on a monthly basis, measures the changes in the prices of goods and services purchased by consumers in the United States (US). The PCE Price Index is also the Federal Reserve’s (Fed) preferred gauge of inflation. The YoY reading compares the prices of goods in the reference month to the same month a year earlier. The core reading excludes the so-called more volatile food and energy components to give a more accurate measurement of price pressures." Generally, a high reading is bullish for the US Dollar (USD), while a low reading is bearish.
Read more.Next release: Wed Apr 30, 2025 12:30
Frequency: Monthly
Consensus: 2.6%
Previous: 2.8%
Source: US Bureau of Economic Analysis
After publishing the GDP report, the US Bureau of Economic Analysis releases the Personal Consumption Expenditures (PCE) Price Index data alongside the monthly changes in Personal Spending and Personal Income. FOMC policymakers use the annual Core PCE Price Index, which excludes volatile food and energy prices, as their primary gauge of inflation. A stronger-than-expected reading could help the USD outperform its rivals as it would hint at a possible hawkish shift in the Fed’s forward guidance and vice versa.
Forex News
Keep up with the financial markets, know what's happening and what is affecting the markets with our latest market updates. Analyze market movers, trends and build your trading strategies accordingly.